
Box and Whisker Chart in Tableau

In this article, we will discuss the Box and Whisker Chart in the tableau. Tableau is a data visualization tool that allows drawing different charts and graphs using Show Me with simple drag and drop.
Tableau Show Me has 24 different charts. Each chart in the tableau corresponds to a minimum number of dimensions, measures, bins, etc.
Best-suited Tableau courses for you
Learn Tableau with these high-rated online courses

What is the Box and Whisker Chart?
- Use to show the distribution of a set of data
- Box-and-Whisker plots are divided into two parts
- Box: Consists of the median, first, and third quartile of the data
- Whisker: Consists of the data with 1.5 times IQR (IQR = first quartile – third quartile)
- Box plot takes one or measure and zero or more dimensions
To know more about Tableau, Click Here.
Let’s understand how to create a Box and Whisker chart in Tableau with an example

 Read Later


Steps to create a Box and Whisker Chart
We want to show category-wise discount discount in ship mode using box and whisker plot
- Connect a file (here, we will use Sample SuperStore data)
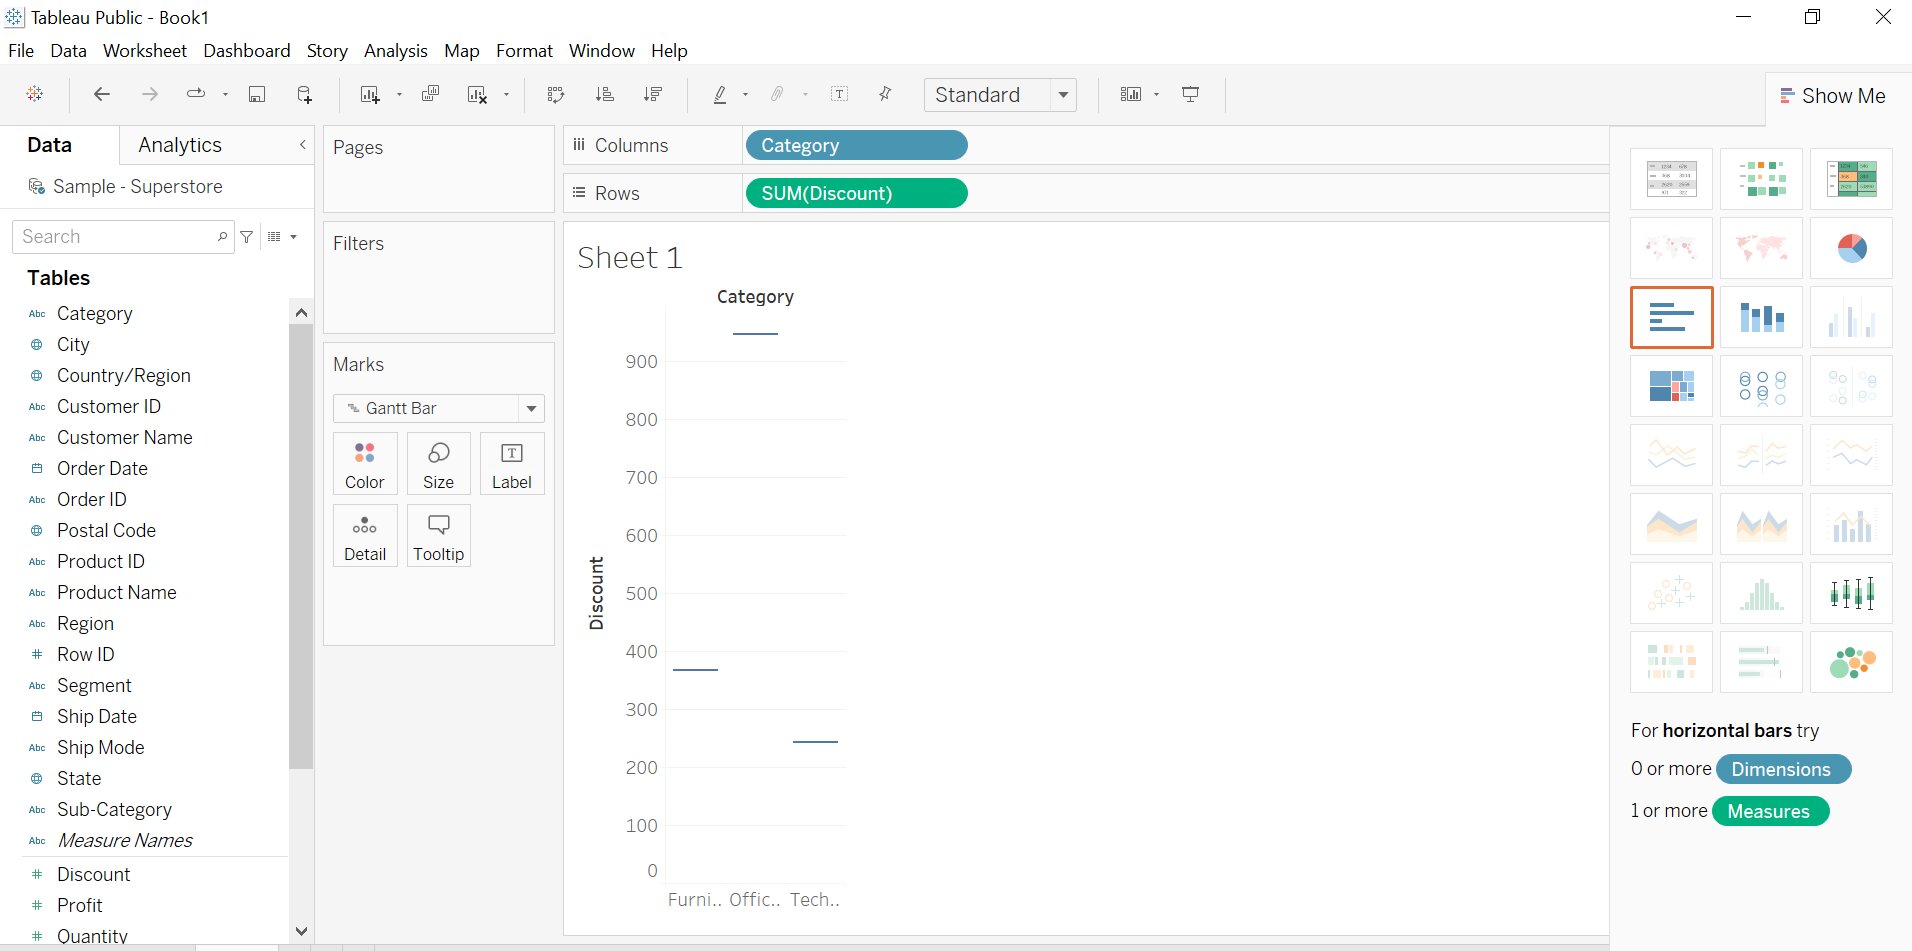
- Drag the Category into the column shelf
- Drag the Discountinto the row shelf
- Tableau creates a vertical axis and displays a bar chart
- This is a default chart type ( one dimension and one column)
- Tableau creates a vertical axis and displays a bar chart
- Drag Ship Mode into the column shelf, right to the Category
- We get, the two-level hierarchy of dimensions from the left two the right
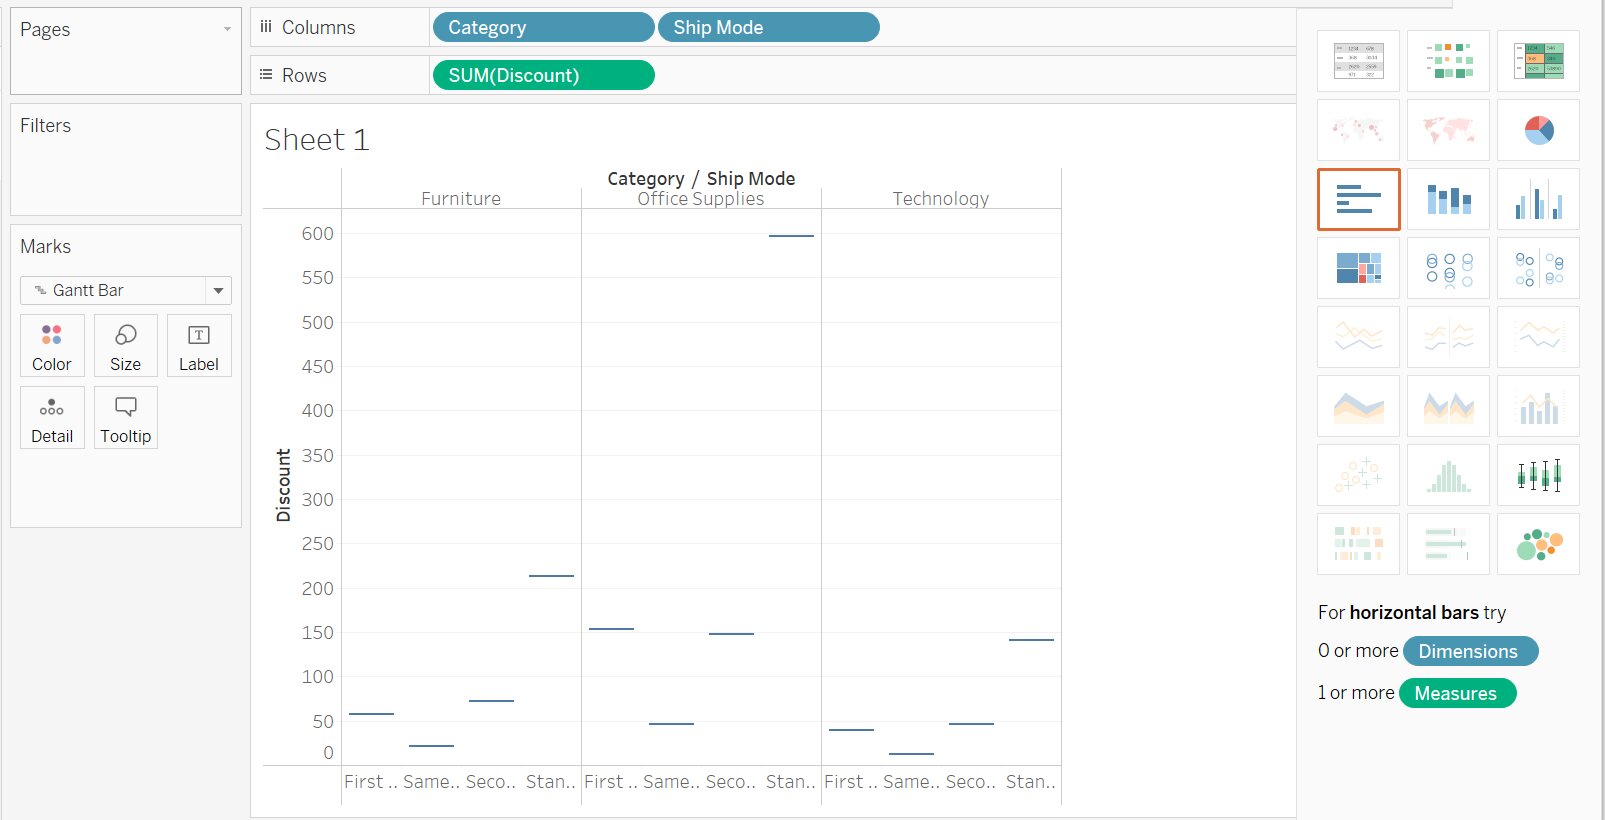
- Now from the Show Me (Right Side Top), Select the Box and Whisker
- We get the desired box and whisker chart

Click Here: To know more about Top Tableau Online Course & Certification.

Conclusion
This article has discussed the Box and Whisker Chart in Tableau with an example.
Hope this article will help you in your data/business analyst journey.
This article is part of a complete tutorial on Tableau, focusing on Tableau-certified data analysts and Tableau desktop specialists.
Through a series of articles, we will cover all the topics in-depth with examples.

Comments