
Statistical Methods Every Data Scientist Should Know

Technology advances have improved how data is collected, but as information piles up, it becomes increasingly complex to organize, manipulate and communicate it. Several researchers agree that Data Science is crucial to understanding large amounts of data. If you want to make important, high-quality, risk-controlled decisions that are based on conclusions about the world beyond the available data, you will need to add an additional and mandatory skill, which is statistics for data science and the corresponding statistical methods.

The key to mastering Data Science is to acquire advanced skills in Applied Statistics, which, in general, is the science that deals with the collection, organization, presentation, analysis, and interpretation of numerical data in order to make effective and pertinent decisions. Statistical methods for data science are traditionally used to organize and summarize numerical data. Descriptive Statistics, for example, deals with the tabulation of data, its presentation in graphic or illustrative form, and the calculation of descriptive measures.
Courses ALERT: Explore FREE Online Courses by top online course providers like Coursera, edX, Udemy, NPTEL, etc., across various domains, like Technology, Data Science, Management, Finance, etc., and improve your hiring chances.
Statistics used in data science and data processing make sense of the information to extract meaningful patterns and trends and to understand “what the data says.” The statistical contribution in Data Science includes the descriptive analysis of the same, the analysis and interpretation of statistical tables and graphs, and regression techniques efficiently applied in predictive models.
You may also be interested in exploring:
Applications of Statistics for Data Science
Overall, we can say that statistics for data science helps to –
- Apply statistical analysis techniques to solve real problems
- Discover the valuable information that the data contains
- Generate predictions based on data
- Communicate your results properly
- Draw conclusions that facilitate decision-making in complex situations
What Are the Most Popular Statistical Methods in Data Science?
Below are some of the most popular statistical methods in data science, extensively used by data scientists, data engineers, machine learning experts, etc.
Descriptive Analysis
It is the simplest. Its purpose is to describe a data set, thus obtaining the parameters that distinguish the characteristics of a data set. The reasons for carrying out descriptive analysis are that it allows for detailed knowledge of the information and its structure. It is limited to making deductions directly from the data and parameters obtained.
Exploratory Analysis
The exploratory analysis consists of a set of statistical techniques that aims to achieve a basic understanding of the data, allowing the detection of outstanding characteristics, such as unexpected and outliers. Exploratory analysis should be the first stage of any data analysis to prevent erroneous or unforeseen data from being processed inappropriately. It is supported by a descriptive approach and is done without accepting preconceptions about the content of the data information.
Applying these statistics for data science techniques makes it possible to study the trend, distribution, and shape of each indicator to study normality on a set of indicators. If this criterion is not met, this analysis guides the type of transformation that must be submitted to the data.
Inferential Analysis
It aims to demonstrate hypotheses raised by providing conclusions with a certain probability or level of confidence. That is, there is no absolute certainty. It is important to note that to perform the inferential analysis, the same dataset should not be used to generate the hypothesis (used in the exploratory analysis) since there would be bias and the conclusions could not be valid.

 Read Later
Predictive Analysis
Predictive analysis is based on identifying relationships between variables in past events, exploiting these relationships, and predicting possible results in future situations. While inferential analysis concerns understanding and demonstrating the relationship, predictive analysis only concerns value. It does not seek, in any case, to understand the system or the relationship between elements.
This process uses the data and analytical, statistical, and machine learning techniques to create a predictive model. A predictive analysis model is developed using a training data set and then tested (with a different data set) and validated for accuracy.
Deepen your understanding of pure and applied mathematics with an online Mathematics degree or course. Learn topics like calculus, linear algebra, probability, statistics, and numerical methods from top universities. Enhance your problem-solving skills and apply mathematical principles to finance, data science, and engineering.
Causal Analysis
Causal analysis helps to find a problem's root cause instead of the symptoms. This technique helps to uncover the facts that lead to a particular situation. It makes it possible to relate causes to effects and how they affect each other. Using causal inference and modelling techniques is the key to effectively investigating and solving problems that can affect the outcomes.
Exploratory Data Analysis
Data scientists use the EDA technique to analyze and investigate data sets and summarize their main characteristics. It also involves using data visualization methods and determining how to manipulate data sources most efficiently to get the desired answers. ED technique helps to discover patterns, spot anomalies, test a hypothesis, or check assumptions.


Linear Regression
Linear regression is a statistical modelling technique that helps to describe a continuous response variable as a function of one or more predictor variables. It can help to understand and predict the behavior of complex systems or to analyze experimental, financial, and biological data.
Linear regression techniques allow you to create a linear model. A linear regression model equation is:
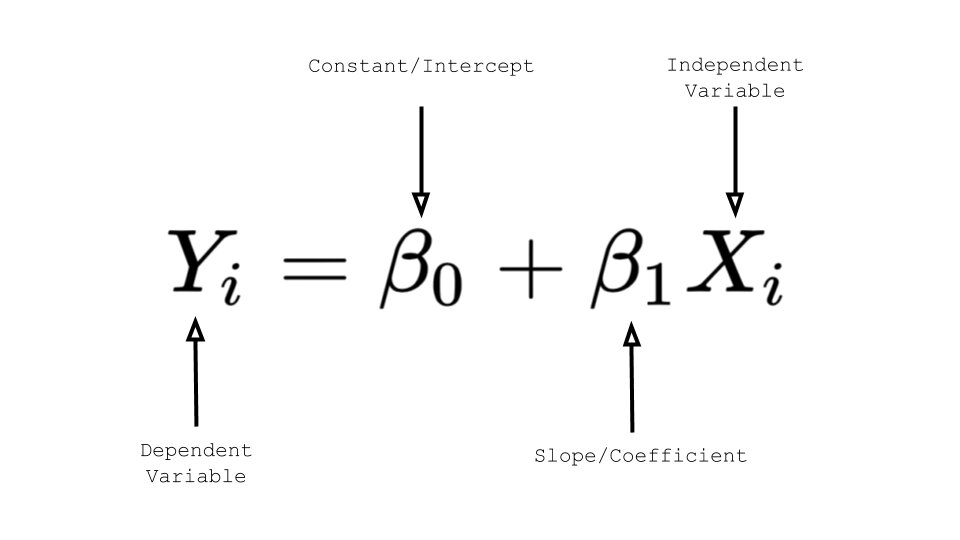
Image Source – Medium
Logistic Regression
Logistic regression is a regression method and among the most popular statistical methods that allow estimating the probability of a binary qualitative variable as a function of a quantitative variable. One of the main applications of logistic regression is binary classification, in which observations are classified into one group or another depending on the variable's value as a predictor.
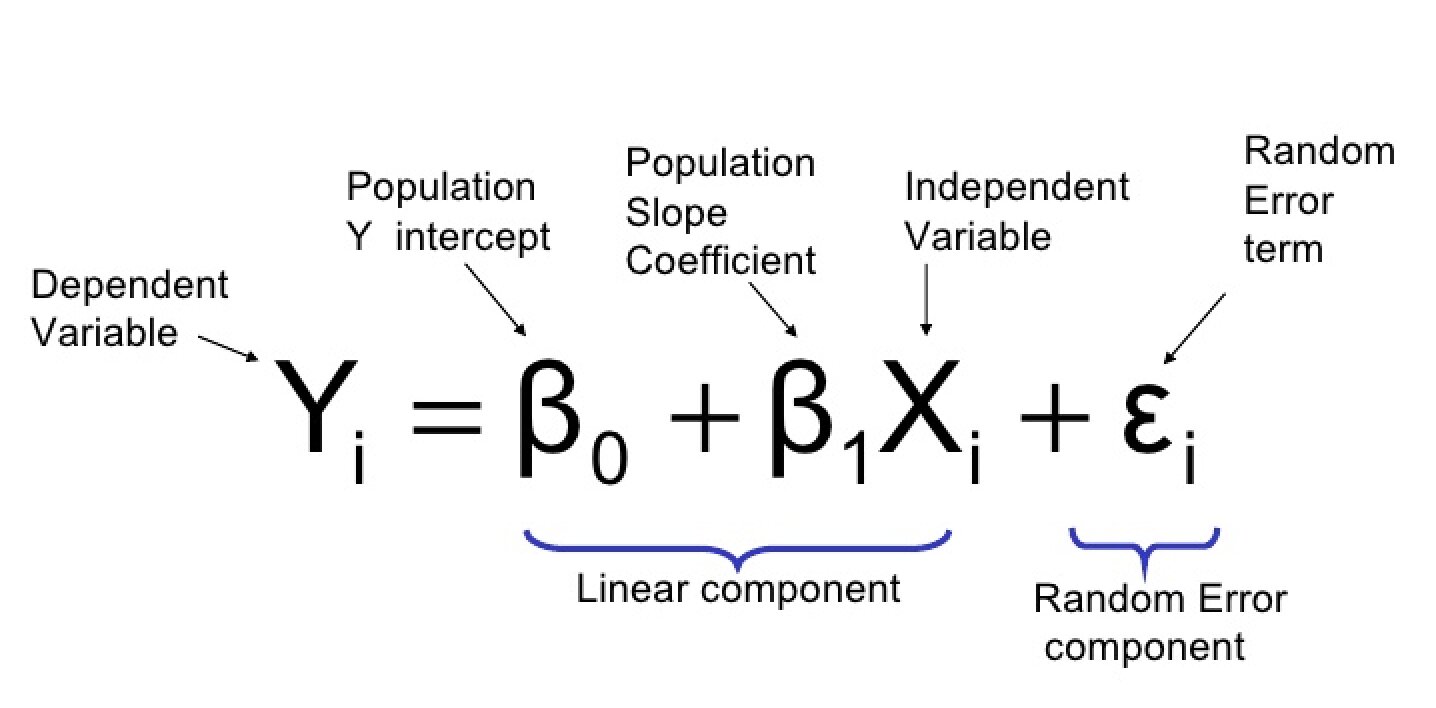
Image Source – Towards Data Science
The fact of having large volumes of data makes it difficult to extract accurate and valuable information to understand complex processes and phenomena. For this reason, statistics used in data science, accompanied by computational algorithms “for learning and obtaining knowledge“, are giving rise to an area expected to have great dynamism in the coming years.

Rashmi Karan is a writer and editor with more than 15 years of exp., focusing on educational content. Her expertise is IT & Software domain. She also creates articles on trending tech like data science,