
Technical Analysis of A Stock: Learning the Basics
In this article, we will learn about the technical analysis of a stock. You will also learn about different technical charts and indicators that are used in the analysis. To study stock movements, traders opt for any one of the methods: technical and fundamental analysis. Online stock technical analysis courses will also be covered in this article. 
Table of Contents
What is the technical analysis of a stock?
The study of historical stock market data is the technical analysis of a stock. It helps in predicting future price movements and also allows traders in making a profit by providing relevant information. Technical analysis of a stock depends on the price action interpretation in a stock. Students can enrol in stock trading courses to learn about the details of this financial marketplace. For now, let us learn about the technical analysis of a stock in detail.
Assumptions for Technical Analysis of A Stock
To understand the technical analysis of stocks, you need to believe in three basic assumptions:
- Market prices reflect stock information: It is essential to know about the stock prices while deciding whether to invest in it. The price information helps in assessing the current value or market value of a company.
- Stock prices follow trends: Stock technical analysis is based on the assumption that stock charts have their own trends. Stock prices usually move within the trend. Every move indicates the next move in stock prices. You will be able to understand trends from the history of that stock.
- Patterns are repetitive: This is a fact that a pattern repeats itself over the course of time. Suppose a pattern is like 1-2-3, then the pattern will restart from 1-2-3. Through such assumptions, you will be able to predict future stock prices.
Best-suited Banking, Finance & Insurance courses for you
Learn Banking, Finance & Insurance with these high-rated online courses

Technical Indicators To Identify Market Trends
There are three types of technical indicators in the stock market:
Let us learn about these stock technical indicators.
Charts
Technical charts are the graphical representation of stock price and volume. Through technical charts, traders can make decisions on financial investment in stocks. The main types of technical charts include:
1. Line Chart
It is one of the simplest technical charts that is used for analysing financial markets. A line chart graphically represents the historical price action of an asset. It is also known as a close-only chart since it plots the underlying security’s closing price through a line that connects dots denoting the closing price.
In the line chart:
- On the x-axis (horizontal axis): time period
- On the y-axis (vertical axis): price levels i.e. the closing price of the underlying security
It is a very easy and understandable graph. Through line charts, one can learn to identify support and resistance levels, trend lines and chart patterns. You will not be able to determine the price range for a session as well as highs and lows.
2. Bar chart
These are one of the most used technical charts for plotting stock prices. This chart plots high, lows, open and close prices for each time period. These can be used in the stock market technical analysis over the course of time. You can spot trends, monitor stock prices and make important trading decisions through these charts.
3. Candlestick Chart
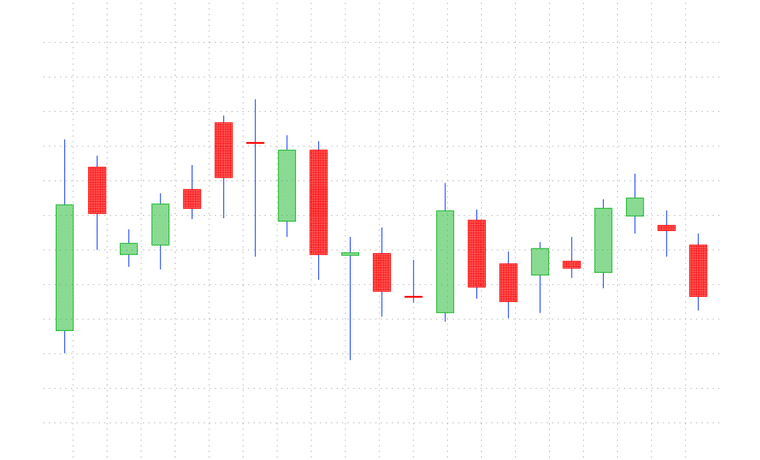
Candlestick charts are one of the oldest technical charts that are used in the analysis of stocks. These charts offer a visual insight into market sentiments and the psychology of traders.
It represents the open and close price, highs and lows for the day. The rectangular bar is called the ‘real body’ which represents the price range between open and close of the day trading. A down candle is coloured in ‘red’ and up candles are coloured in ‘green’.
The two ‘lines’ that are extending from the real body are known as shadows or wicks. These wicks represent the low and high prices of the day’s trading. Candlestick charts are effective in highlighting the difference between open and close.
In candlesticks charts, many patterns are formed due to the up and down price movements. The two main patterns in candlestick charts are bullish and bearish. Bullish indicates the probability of price rise and bearish patterns indicate price fall.
4. Renko Chart
It is a technical chart built using price movement instead of price and standardised time intervals. Whenever a price moves a specified price amount, a new brick is created. Each of these bricks is positioned at a 45-degree angle prior to another brick. Traders can view asset price movements that filter out minor price movements through Renko charts.
Renko charts are easier to read as compared with candlestick charts since the markers are more uniform on Renko charts. Through Renko charts, traders can focus on important trends but due to the simple brick construction, you may lose out on some price information. Traders can effectively identify resistance levels and support.
5. Point and Figure (P&F) Chart
A point and figure chart helps in plotting price movements for bonds, commodities, futures and stocks without considering time. Technical analysts use the concept of support and resistance in the case of P&F charts. These charts are less susceptible to false breakouts.

 Read Later

Moving Averages
- It is one of the technical indicators that help in smoothening out the price data by creating a constantly updated average price.
- Traders calculate the moving average to identify the trend direction of the stock. These also determine its support and resistance levels. This tool is based on past prices and hence it is a trend following/lagging indicator.
- These are completely customizable technical indicators thus allowing investors to choose a time frame for calculating the average. A shorter time span will turn the average more sensitive to price changes. A longer time span will make the average less sensitive.
- Those who want to opt for short term trading can choose a shorter moving average. Those who want long term investment can choose long term moving averages. There are two types of moving average: Simple and Exponential moving average.
Momentum Indicators
Momentum indicators are the stock market technical analysis tools that determine the strength and weakness of the stock price. In simple terms, this technical indicator measures the rate at which stock price fluctuates. These technical indicators only hint at the time in which market price change is taking place.
Moving average convergence divergence (MACD) and relative strength index (RSI) are the two common momentum indicators.
MACD: This is a trend following the MOM indicator that indicates the relationship between two moving averages of a financial instrument’s price. It moves between moving average. You can calculate it by subtracting the 26-day EMA from the 12-day EMA.
Then, you will plot the 9 day EMA (signal line) on a graph along with the MACD line. Traders get an indication of whether to buy or sell through MACD.
RSI: It is an oscillator that measures price change and the change rate. The indicators swing between 0 and 100. It helps in identifying uptrend and downtrend.
To calculate the value of MOM indicators, you can use the following formula:
MOM= (current closing price/closing price of the previous period) x 100

Importance of Stock Technical Analysis
Technical analysis of a stock is important for the following reasons:
- Stock technical analysts use the approach of probability to pick stocks. They can predict the outcome of any action without the need for in-depth scrutiny. These professionals will provide you with stock price movement details without much information.
- It takes less time than fundamental analysis. Those who want to earn returns in a shorter time period should opt for technical analysis of stocks.
- Through various technical charts and technical indicators, you can learn to understand the changes in patterns. Through the in-depth study, you will be able to detect changes in price movement. This will prevent you from facing huge losses.
Online Technical Analysis Courses For Stocks
The following courses are useful for stock analysis:
| Courses | About Stock Analysis Courses |
| Technical Analysis by Zerodha | This technical analysis course covers different chart types, candlestick patterns used by traders, different types of indicators including moving average. Further details related to support and resistance price levels will be covered as well in this course along with their relevance in technical analysis. |
| Forex Trading using Fundamental and Technical Analysis - Technical Analysis | This courses helps students learn about both fundamental and technical analysis of stocks when it comes to forex trading. After completing this course, students will be able to analyze global market and select currency pairs suitable for their trading objectives. |
| Technical Analysis Made Easy | This course covers the principles and tools used in technical analysis and to analyze the relation between volume and open interest to confirm trends. Students will learn to analyze market movements by drawing trendlines and identifying support and resistance levels. |
| Certification in Technical Analysis | This course covers different trading patterns, trading tactics and money making techniques to get positive ROI in financial markets. The course touches key areas to explain the psychology of a successful trader. Students will also learn the use of Fibonacci through this course. |
| Certification in Online Essential Technical Analysis | By enrolling in this course, students will learn to develop intraday or positional trading strategies that will align their skillset with capital investment and personal goals through different chart patterns and trading systems. Risk reward analysis will be also covered that can be usef for risk assessment and money management. |
As a trader, when you study stock prices, at a single glance, the prices appear to be fluctuating on an everyday basis. Over a period of time, as you study the price movement, you will notice trends and patterns emerging in the price movement. This study is possible through technical charts and trends and is known as technical analysis. Technical analysis aims to make investment decisions based on patterns and trends.
