
Cohort Analysis in Tableau
 Call 8585951111
Table of Content
What is Cohort Analysis?
Before defining Cohort Analysis, let’s understand what Cohort is?
A cohort is a collection (or a subset) of users with common characteristics.
In terms of business, a cohort refers to the users that are grouped by the acquisition date.
A Cohort Analysis is an analytical technique that categorises and divides the data into groups of common characteristics (or properties) before analysis.
It allows comparing the behaviour and metrics of different groups over time. Using cohort analysis, you can find the performance and factors affecting the cohort’s performance.
Let’s understand with the help of an example:
Problem Statement: A company launched an app five days ago. Now, the company wants to know the daily cohort of users who comes to the app on the very first and revisit in the next five working days.

From the above retention table, you can easily depict the number of users who visited that app and the % of active users on different dates. Finally, the critical point is the retention rate of the users over the app.
Out of all the new users in the last five working days (7475), only 50% of users are retained on day 5.
Must Check: What is Tableau?
Must Check: Tableau Online Courses & Certifications
Best-suited Tableau courses for you
Learn Tableau with these high-rated online courses

How to do Cohort Analysis in Tableau?
We will understand how to do cohort analysis in Tableau with an example.
Problem Statement: In Sample Super Store Data, using cohort analysis, compute the number of distinct customers who purchased the items(product) again.
We will solve the above problem in two steps:
- Create Calculated Fields
- Compute the first purchase date of each customer
- Compute the next purchase date of each customer
- If the order dates are the same, then return NULL
- Compute the second purchase date by setting a minimum of the next purchase date
- Compute the month difference between the first purchase date and the second Purchase date
- Build View
- Here we will create a visualization

 Read Later
Create Calculated Field
- Connect Sample Super Store Data
- Select Analysis -> Create Calculated Fields
- Dialog Box Will appear
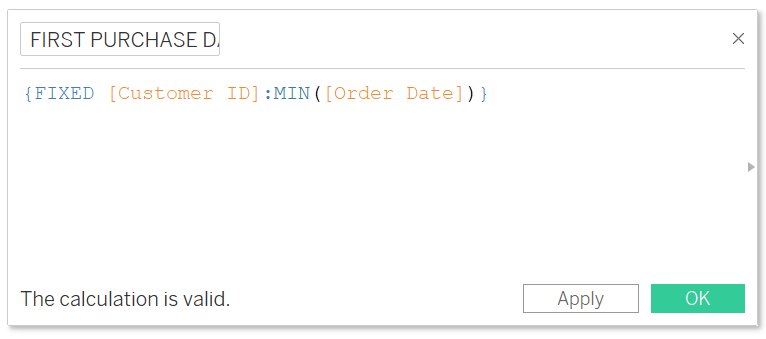
- Create First Purchase Date using Minimum of Order Date
- Dialog Box Will appear
- Select Analysis -> Create Calculated Fields
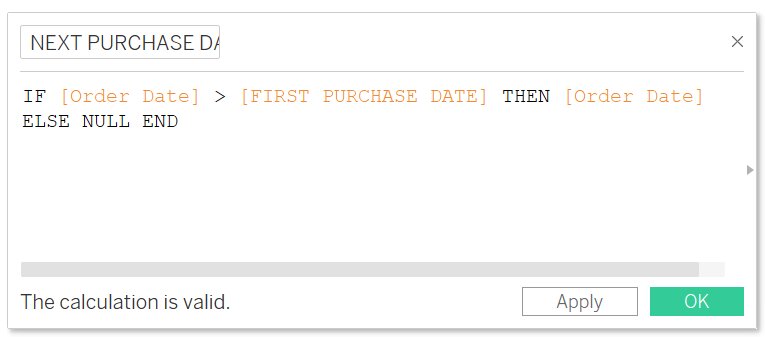
- Create Next Purchase Date using if-else
- Select Analysis -> Create Calculated Fields
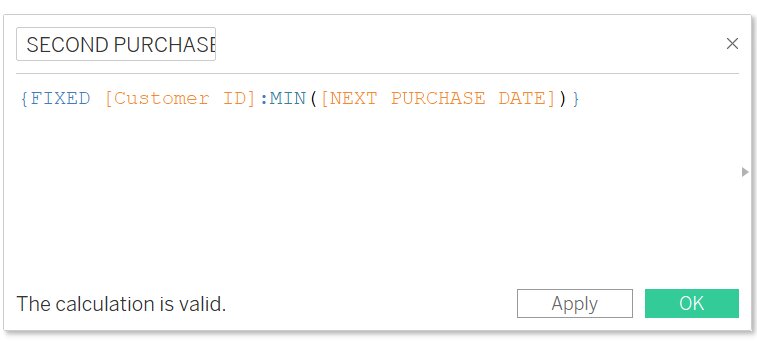
- Create Second Purchase Date using the minimum of the Next Purchase Date
- Select Analysis -> Create Calculated Fields
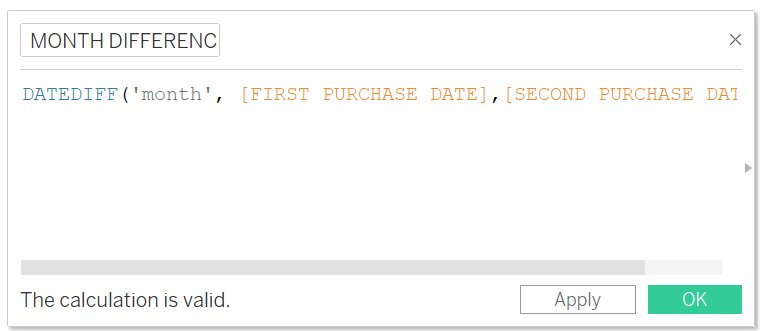
- Create Month Difference using DATEDIFF
Build View
- Drag and Drop Year Difference from Measure to Dimension, then drop to Column Shelf
- Drag and Drop First Purchase Date to Row Shelf
- Right-Click on First Purchase Date -> Select Month
- Right-Click on First Purchase Date -> Select Discrete
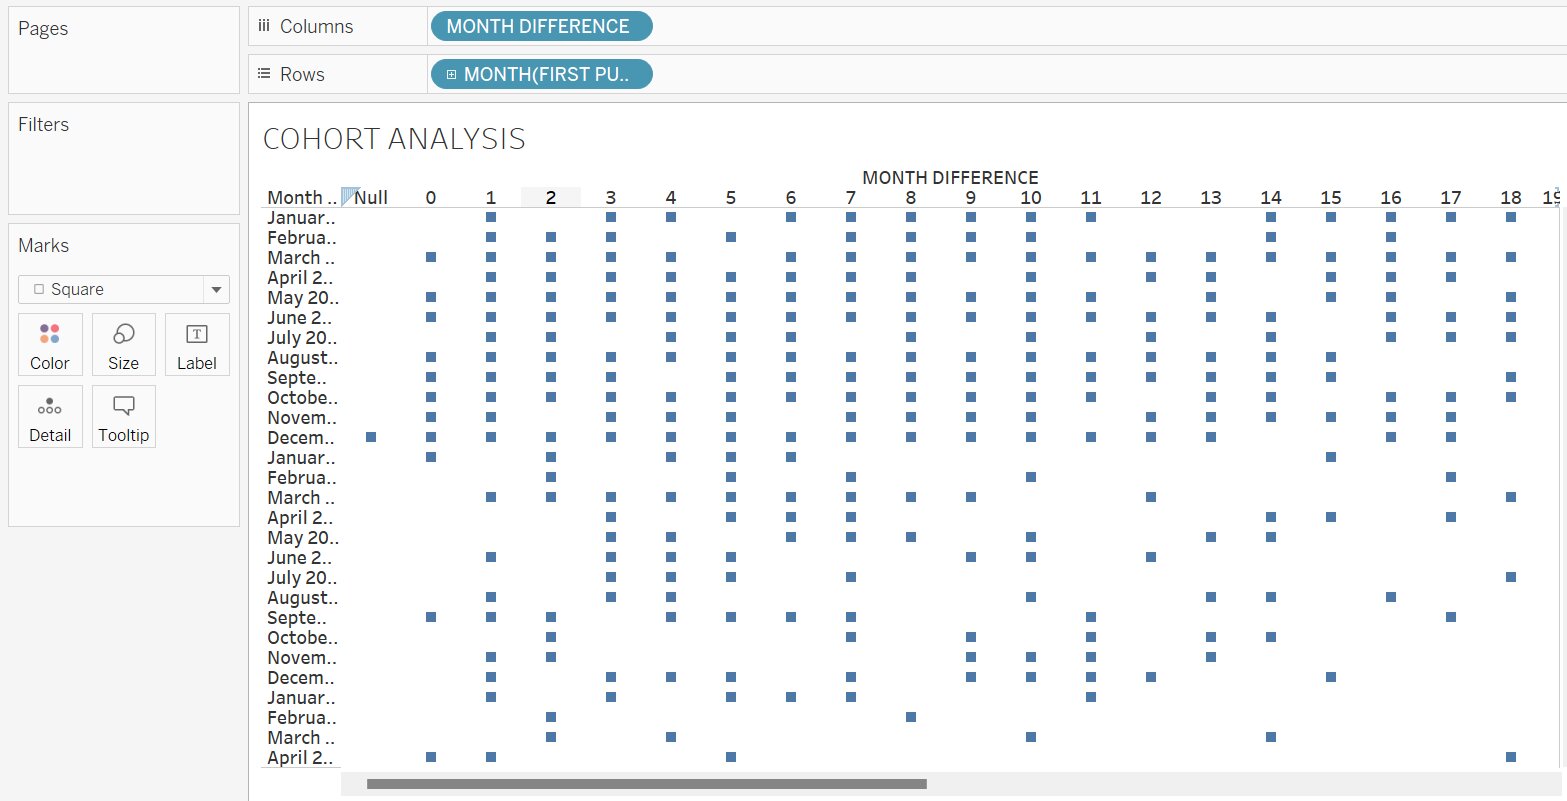
- Drag and Drop Customer ID to Color in the Marks Pane
- Right Click on Customer ID in Marks Pane -> Select Measure -> Select Count(Distinct)
- Drag and Drop Customer ID to Text in the Marks Pane
- Right Click on Customer ID in Marks Pane -> Select Measure -> Select Count(Distinct)
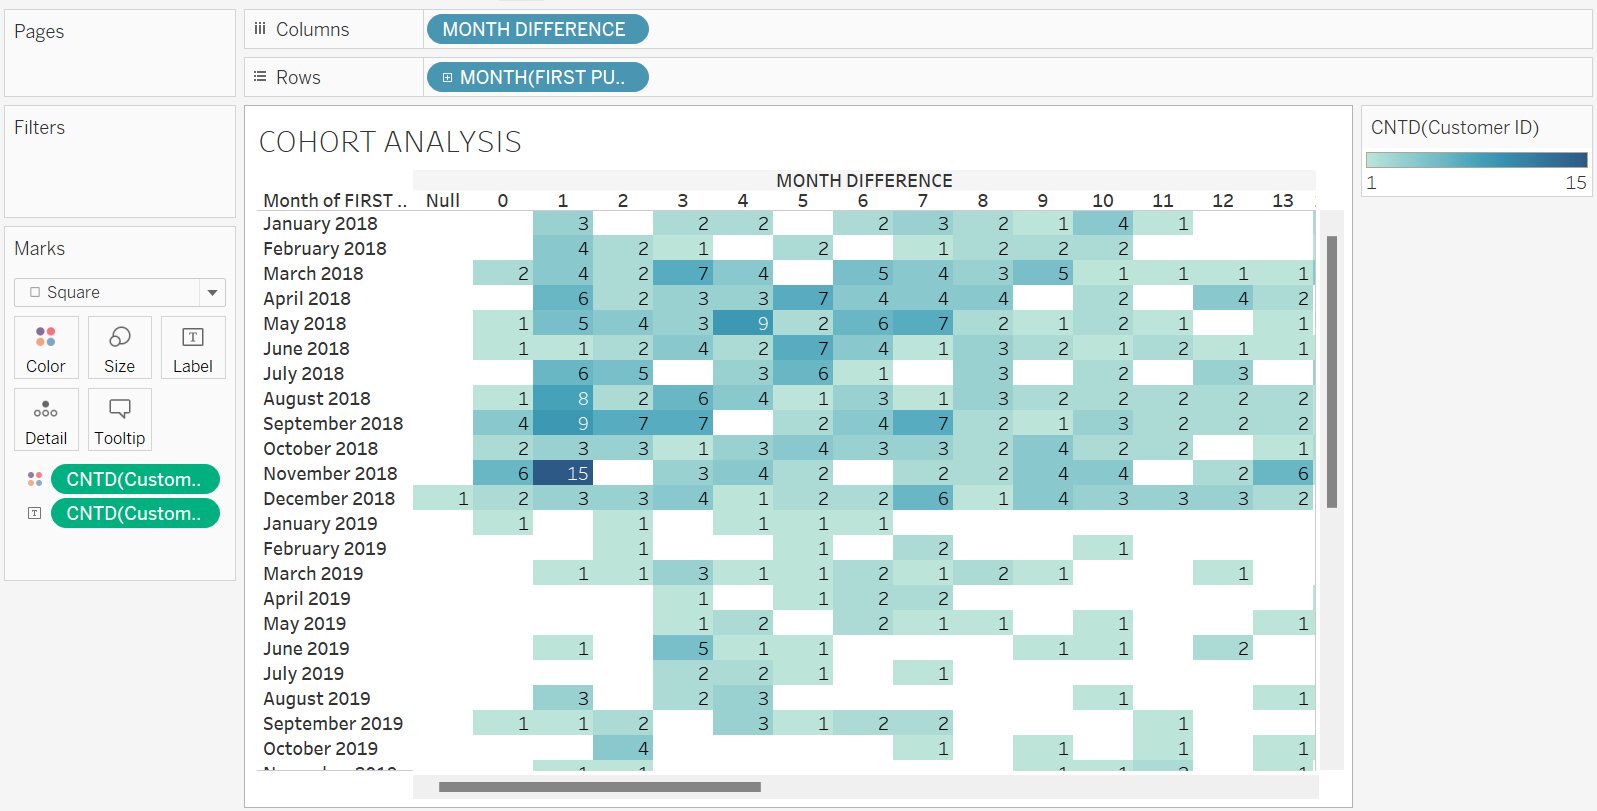
We can check the number of distinct customers who came back to buy a product after their first purchase from the above figure.
Note: Here, Null indicates that the customer never returns to repurchase the product.


Additional Resource
Removing Null
- Drag and Drop Month Difference to Filters Pane
- A filter dialog box will appear
- Uncheck Null
- Click OK
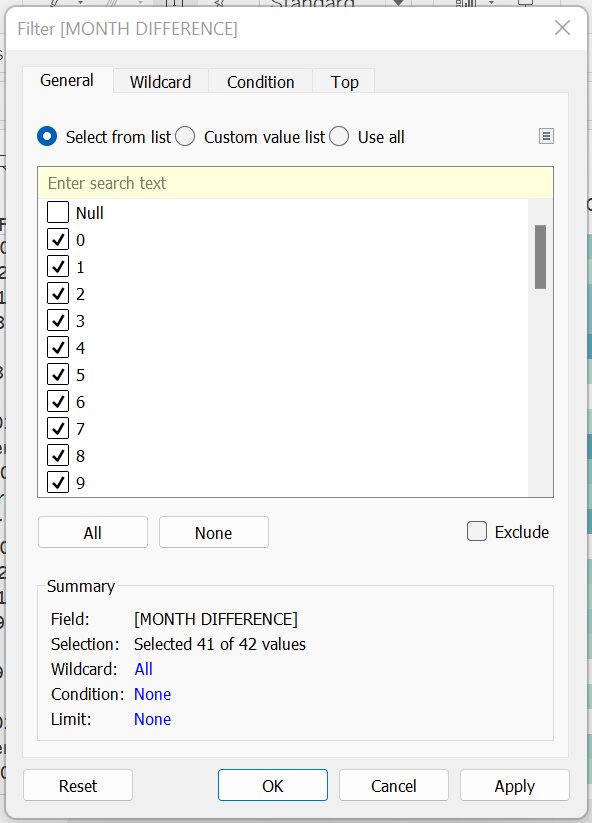
You will get the below visualization which doesn’t contain the Null Column.

Changing Count (distinct) to Percent of Total
Now we will change the distinct Count of customer id to the percentage of the total to get the customer’s retention rate every month.
- Right-Click on CNTD(Customer ID) in marks pane -> Select Quick Table Calculation -> Select Percent of Total
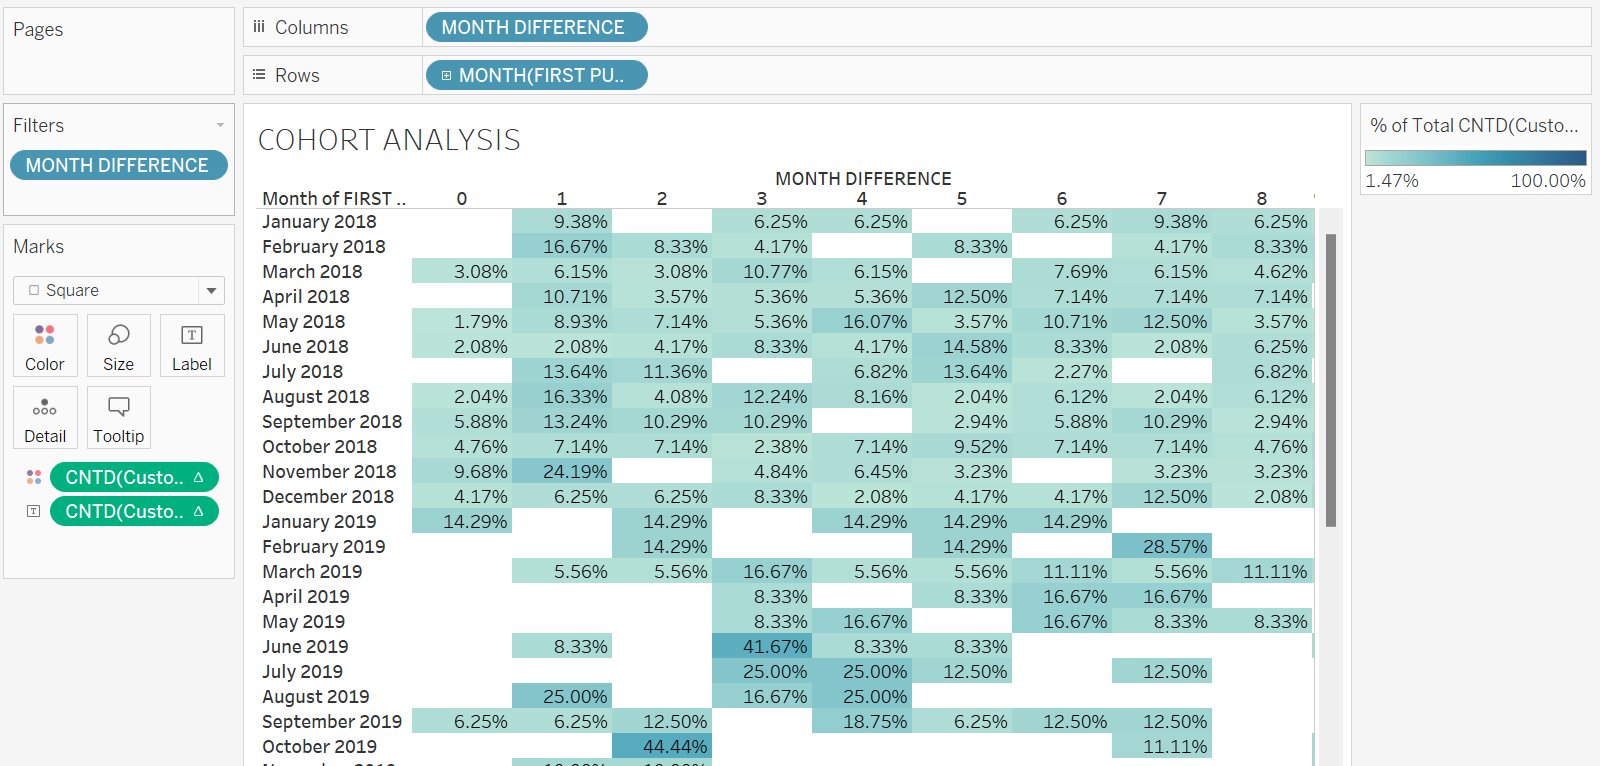
Note: We have to do the same above step for both the CNTD(Customer ID) ), i.e., for both color and text).


Conclusion
In this article, we had briefly covered how to do cohort analysis in tableau with the help of a sample super store data.
Hope this article, will help you in your Data Analytics journey.
Top Trending Articles:
Data Analyst Interview Questions | Data Science Interview Questions | Machine Learning Applications | Big Data vs Machine Learning | Data Scientist vs Data Analyst | How to Become a Data Analyst | Data Science vs. Big Data vs. Data Analytics | What is Data Science | What is a Data Scientist | What is Data Analyst

Comments