
Data Aggregation in Tableau
 Call 8585951111
In this article, we discussed different aggregation functions in tableau, how to change the aggregation of a measure in a view and how to disaggregate the data.

Introduction
In this article, we will discuss, data aggregation in tableau.
The different aggregations available for a measure determine how the individual values are collected: they can be added (SUM), averaged (AVG), or set to the maximum (MAX) or minimum (MIN) value from the individual row values.
Tableau has many predefined aggregate functions like ATTR, AVG, CORR, COUNT, COUNTD and many more.
Let’s discuss data aggregation in tableau in detail:
Best-suited Tableau courses for you
Learn Tableau with these high-rated online courses

Table of Content
- What is Aggregation?
- Why use the aggregate functions?
- List of predefined aggregate functions in Tableau
- Change the aggregation of a measure in view
- How to disaggregate the data?
What is aggregation?
Aggregation is a mathematical operation (operation like sum, average, count, etc.) that takes multiple values and returns a single value.

Why use the aggregate functions?
Aggregate functions return a summary of the dataset.
Let’s understand this by an example:
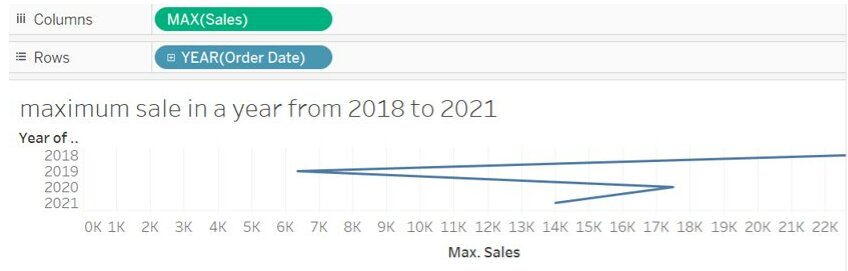
if you want the maximum sale of every year from the superstore dataset.
You can use the max() function to summarize the data.
List of predefined aggregate functions in Tableau
1. SUM
- Returns sum of all values
- Used only with numeric fields (null values are ignored)
- Syntax: SUM (expression)
2. AVERAGE
- Return the average (sum of all values/ number of values) of all expression
- Used only with numeric fields (null values are ignored)
- Syntax: AVG (expression)
3. MAX
- Return maximum of an expression across all records
- For a string value, it returns the last value in alphabetical order
- Syntax: MAX (expression)
4. MEDIAN
- Return the median of an expression across all the records
- Used only with numeric fields (null values are ignored)
- Syntax: MEDIAN (expression)
5. MIN
- Return the minimum of an expression across all the records
- For a string value, it returns the first value in alphabetical order
- Syntax: MIN (expression)
6. COUNT
- Returns the number of all items in a group
- Null values are not counted
- Syntax: COUNT (expression)
7. COUNTD (count distinct)
- Returns the number of distinct items in a group
- Null values are not counted
- Syntax: COUNTD (expression)
8. VAR
- Returns the statistical variance of all values based on the sample of a population
- Syntax: VAR (expression)
9. VARP
- Returns the statistical variance of all values on the entire population
- Syntax: VARP (expression)
10. STDEV
- Returns the statistical standard deviation of all values based on the sample of a population
- Syntax: STDEV (expression)
11. STDEVP
- Returns the statistical standard deviation of all values on the entire population
- Syntax: STDEVP (expression)
12. PERCENTILE
- Returns the percentile value
- The number must be between 0 and 1
- Syntax: PERCENTILE (expression, number)
13. COVAR
- Return the sample covariance of two expressions
- Covariance qualify how to variable change together
- Syntax: COVAR (expression1, expression2)
14. COVARP
- Return the population covariance of two expressions
- Syntax: COVARP (expression1, expression2)
15. CORR
- Return the Pearson correlation coefficient of two expressions
- It measures the linear relationship between two variables
- The value ranges from -1 to 1
- Syntax: CORR (expression1, expression2)
16. ATTR
- It returns the value of the expression if it has a single value for all rows. Otherwise returns an asterisk.
- Null values are ignored.
- Syntax: ATTR (expression)
Tableau allows changing the aggregation of a field for specific use in the worksheet.
Change the aggregation of a measure in View
As tableau automatically aggregates its value using predefined aggregate functions.
The current aggregation appear as a part of the measures name in the view.
i.e when we put Sales in view it appears as SUM (Sales) or MAX (Sales).
Every measure has a default aggregation which is predefined by Tableau itself.
We can change the aggregation for a measure from its context menu.
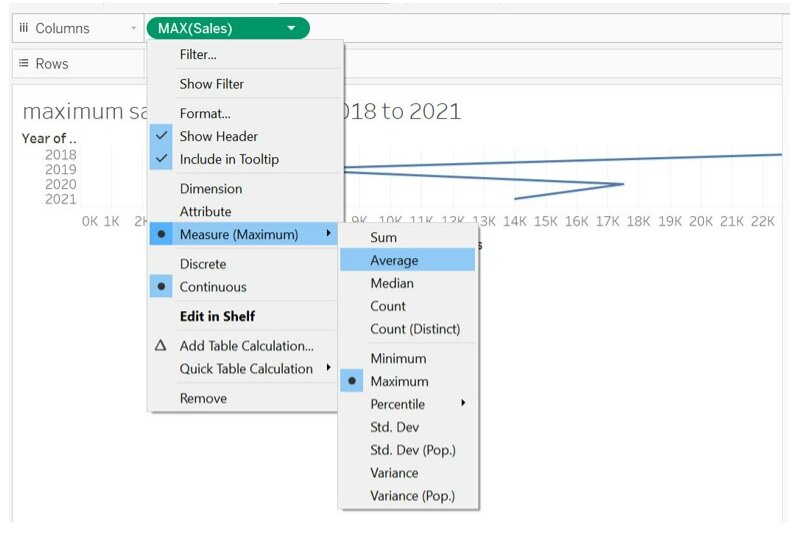
From the drop-down, we can select any of the following options.
Note: Aggregate measures in Tableau works only for relational data sources.
How to Disaggregate the Data?
Disaggregating
Disaggregating data means that Tableau will display a separate mark for every data value in every row of your data source.
As we know, whenever we add a measure to view aggregation is applied automatically.
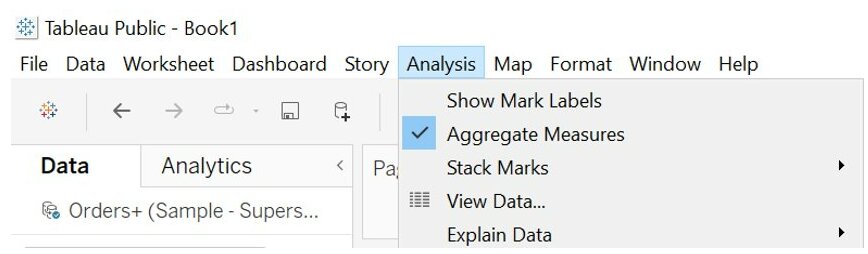
This default is controlled by the Aggregate Measures setting in the Analysis menu.
If you decide you want to see all of the marks in the view at the most detailed level of granularity, you can disaggregate the view.
Steps to disaggregate all the measures in View
Analysis -> Aggregate Measures
(If you already selected, click Aggregate Measures to deselect it)
Conclusion
In this article, we discussed different data aggregation in tableau, how to change the aggregation of a measure in a view and how to disaggregate the data.
Hope this article will help you in your data analyst journey.
This article is a part of a complete tutorial of Tableau, focusing on Tableau certified data analysts and tableau desktop specialists.
Through a series of articles, we will cover all the topics in-depth with examples.

 Read Later


Comments