
Create Table, line chart and Scatter Plot using Tableau Show Me
 Call 8585951111
In this article we will discuss Tableau Show me . Show me is the advanced visualization tool in Tableau to make data visualization easy without writing any custom codes.

In this article, we will discuss Tableau Show me.
Show me is the advanced visualization tool in Tableau to make data visualization easy without writing any custom codes. It consists of some most common graphs and charts in Tableau.
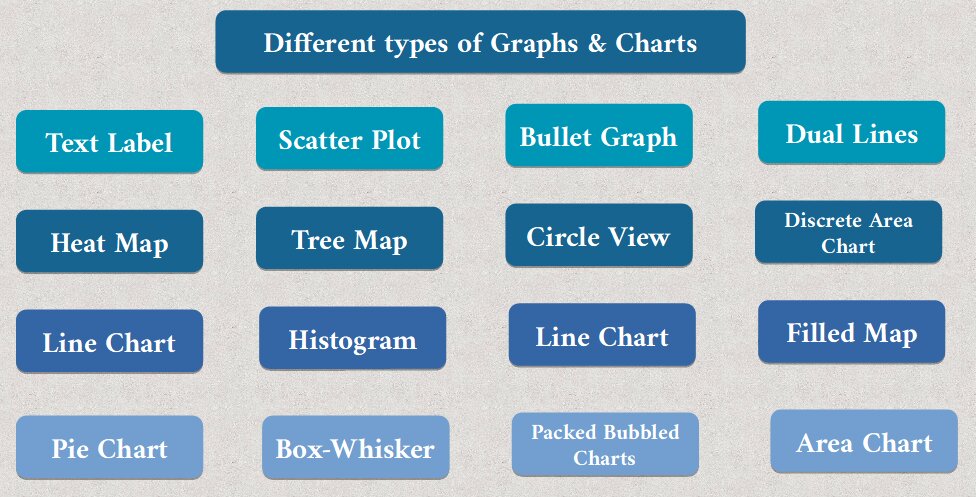
Table of Content
Tableau show me created to help different types of businesses to create highly analytic, interactive visuals and dashboards that are useful and visually appealing.
It creates a view based on the fields that are already used in the view and any fields you have selected in the data pane.
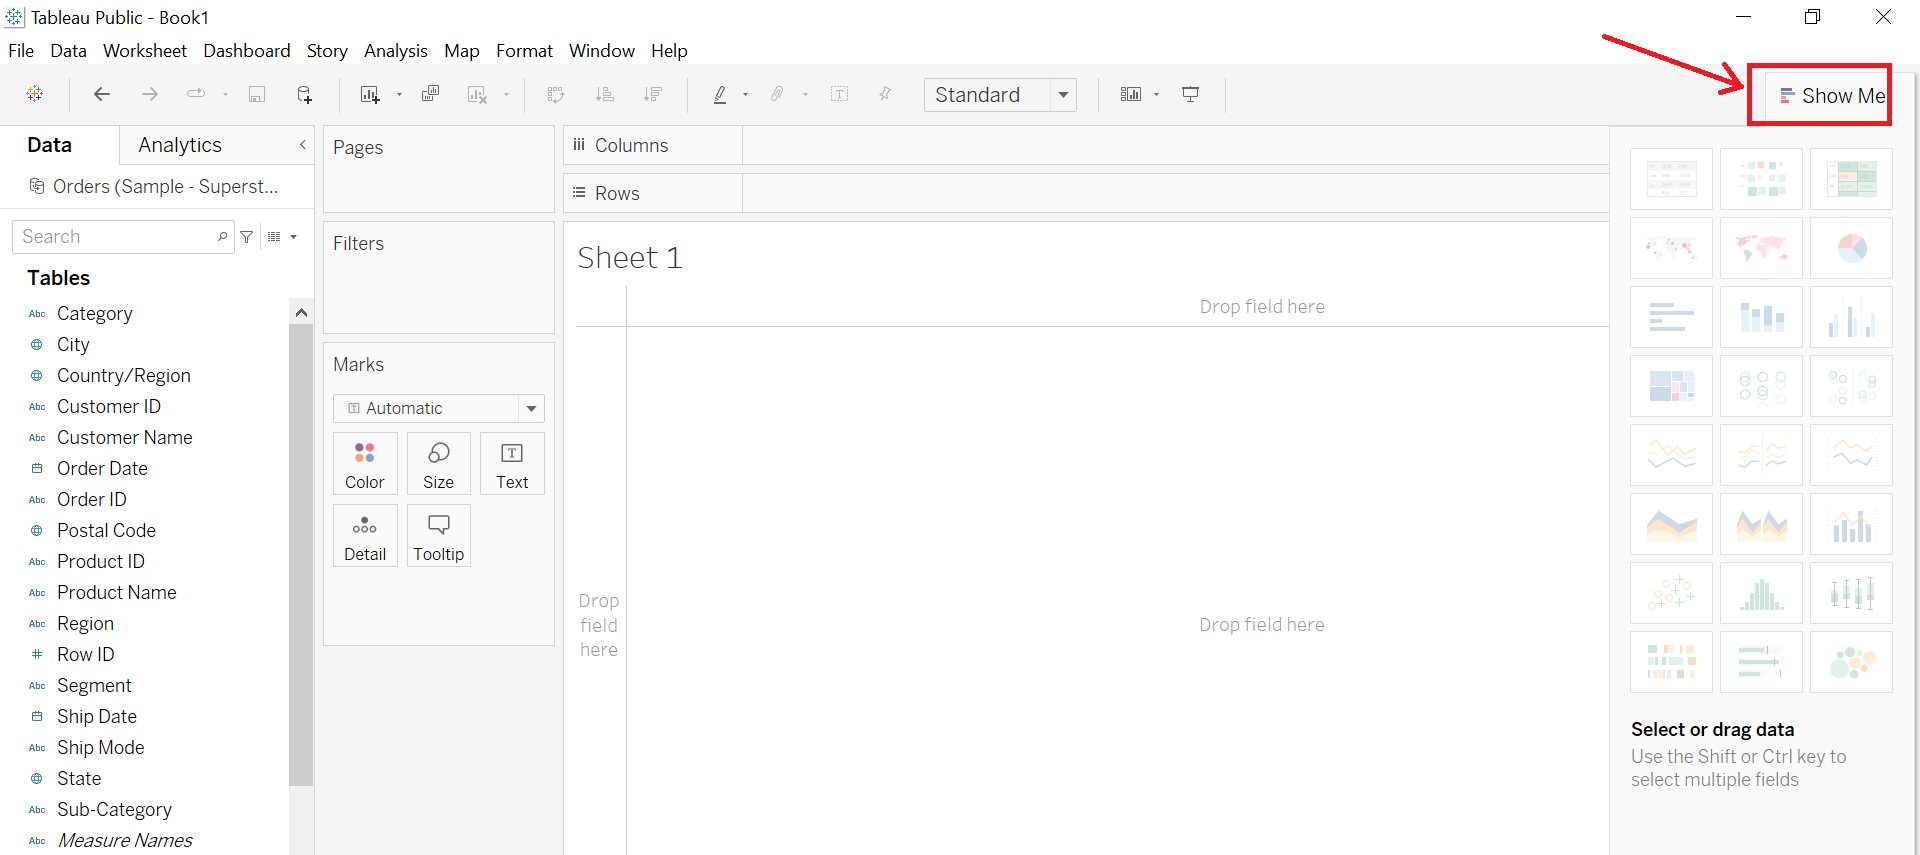
The show me button is available on the right side of the worksheet.

Best-suited Tableau courses for you
Learn Tableau with these high-rated online courses

Steps to Use Show me
- Select the fields you want to analyze from Data Pane
- Hold the ctrl key (command key on Mac) for multiple selections
- Select the type of view you want to create from Show me Pane
- Tableau automatically creates a view of the data
Note: In the article, we will use Sample Superstore data to show different graphs and charts using the Show Me tool

Create a Table using Show Me
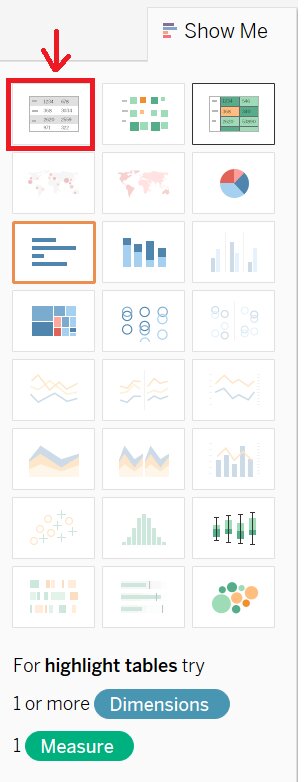
In this example, we will use Show Me to create a table that displays customer segment and sales using superstore data.
- From the data pane select segment and sales
- Click Show me on the toolbar
- From Show me Pane, select the table option (first chart in show me pane)

Create a Line Chart using Show Me
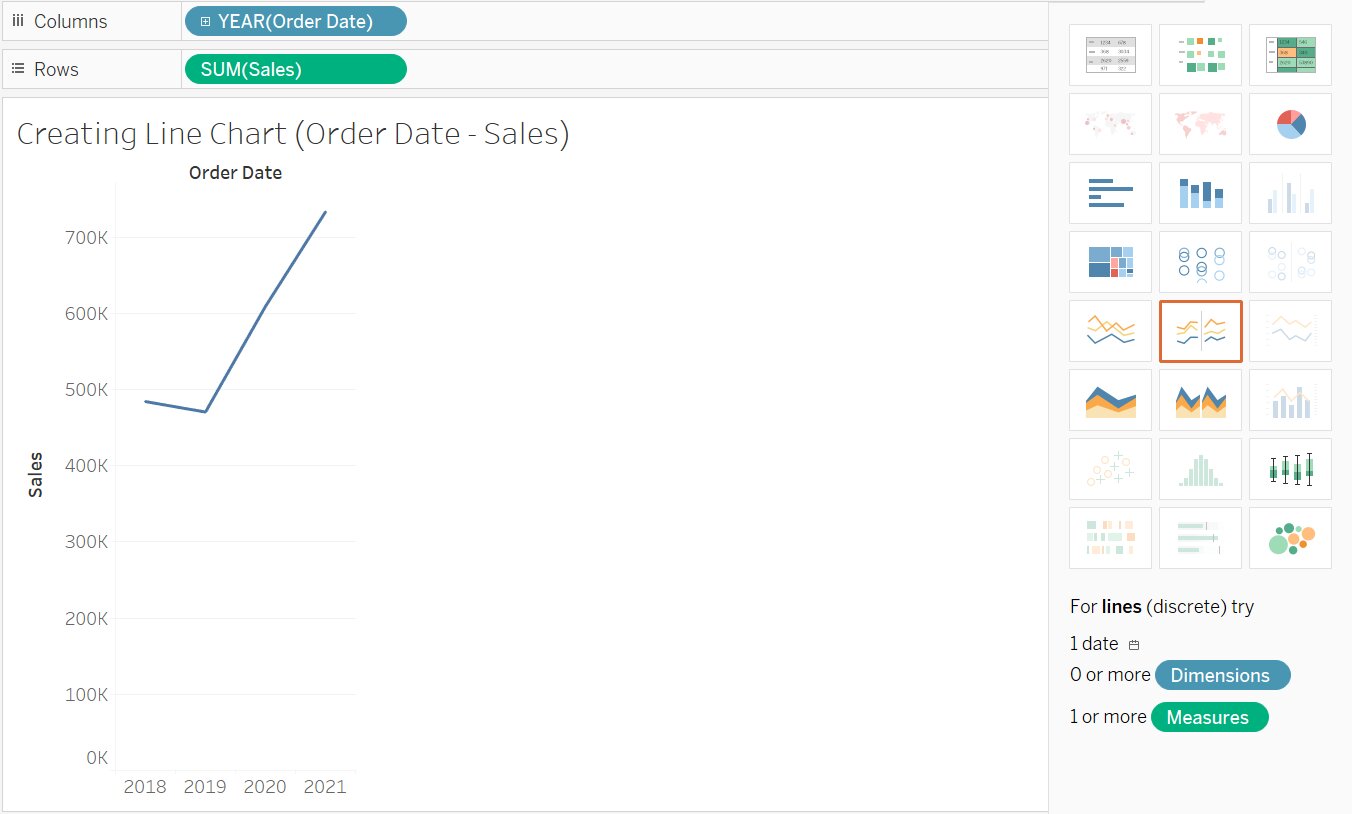
In this example, we will use Show Me to show the Sales in the different years using superstore data
- From the data pane, select order date and sales
- Click Show me on the toolbar
- In the show me, see what Tableau suggest
- Tableau automatically suggests a line chart as it is an optimal way to look at how data changes over time
Now, in the next example, we will see Show me with multiple fields
Create a Scatter Plot using Show Me
In this example, we will create a scatter plot to show sales vs profit for different products and years.
- From the data pane, select order date, product id, profit and sales
- Click Show me on the toolbar
- In the show me, see what Tableau suggest
- Tableau automatically suggests a scatter plot, you can drag fields to refine.

Similarly using the same steps we can create different charts like heat maps, histograms etc.
Conclusion
In this article, we have discussed a data visualization tool Tableau show me, which is used to make analytics and visualization very easy without writing any piece of code.
Hope this article will help you in your data analyst journey.
This article is a part of a complete tutorial of Tableau, focusing on Tableau certified data analysts and tableau desktop specialists.
Through a series of articles, we will cover all the topics in-depth with examples.

 Read Later

Data Analyst Interview Questions Data Science Interview Questions Machine Learning Applications Big Data vs Machine Learning Data Scientist vs Data Analyst How to Become a Data Analyst Data Science vs. Big Data vs. Data Analytics What is Data Science What is a Data Scientist What is Data Analyst

Comments