
Statistics for Business: Why is it Important?

Business statistics comprises utilizing various statistical analysis tools in a business context. It primarily comprises descriptive statistics, which summarize data, and inferential statistics, which draw conclusions and make predictions based on data insights. These statistical methods help businesses make data-driven decisions, identify trends, and optimize strategies, ultimately improving efficiency and profitability.
Statistics is crucial in business as it helps them make decisions based on historical data and ongoing trends. The correct data always serves as the basis for critical decisions; this is why businesses always go to in-depth research to grow their venture. Statistics for business use tools that we primarily use in mathematics, such as mean, median, bell curve, probability, bar graphs, etc.
Let’s learn about statistical analysis and how businesses are leveraging it.
Table of Contents
Understanding Statistics for Business
Statistical analysis involves collecting, organizing, and interpreting data meaningfully. Business statistics offers data to managers, helping them make successful decisions based on fundamental values rather than intuitions. Statistics is used to analyze data and make interpretations, whether for sales estimation, introducing a new product line, developing new production strategies, etc.
The primary purpose of business statistics is data collection, allowing managers to evaluate past performance, forecast future business practices, and run the organization profitably. Furthermore, it becomes the basis for risk navigation, sales prediction, market trends, changing consumer behavior, price determination, etc.
Suggested Read- Basics of Statistics for Data Science

 Read Later
Best-suited General Management courses for you
Learn General Management with these high-rated online courses

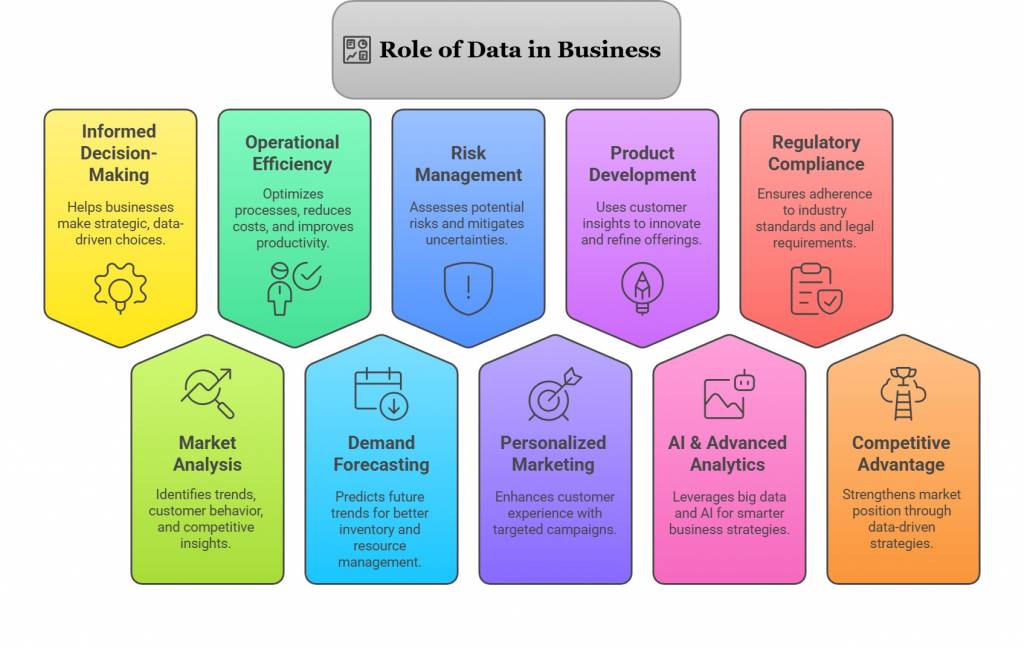
The Role of Data in Business
For businesses that envision gaining a competitive edge, data is the right tool they should invest in. The main reason behind the success of any big firm is its emphasis on data and research.
For example- Amazon recommends their customers based on their past orders and buying behavior. They use machine learning and data analytics to drive their recommendation engines rather than blindly suggesting [products to customers.
Similarly, Starbucks uses an analytical approach to identifying its future store locations. It partners with a location analytics company to find ideal store locations. Starbucks continuously uses data to make informed decisions about finding new customers, acquiring customer insights, targeting marketing campaigns, spotting fraud, identifying other business risks, etc.

A business can benefit in myriad ways when it utilizes accurate data. Let’s find out how.


Types of Statistical Methods For Business Use
Statistical methods in business help analyze data, identify trends, and support decision-making. These methods are broadly categorized into descriptive statistics, which summarize and interpret data, and inferential statistics, which draw conclusions and make predictions. By leveraging these techniques, businesses can optimize strategies, minimize risks, and enhance overall performance.
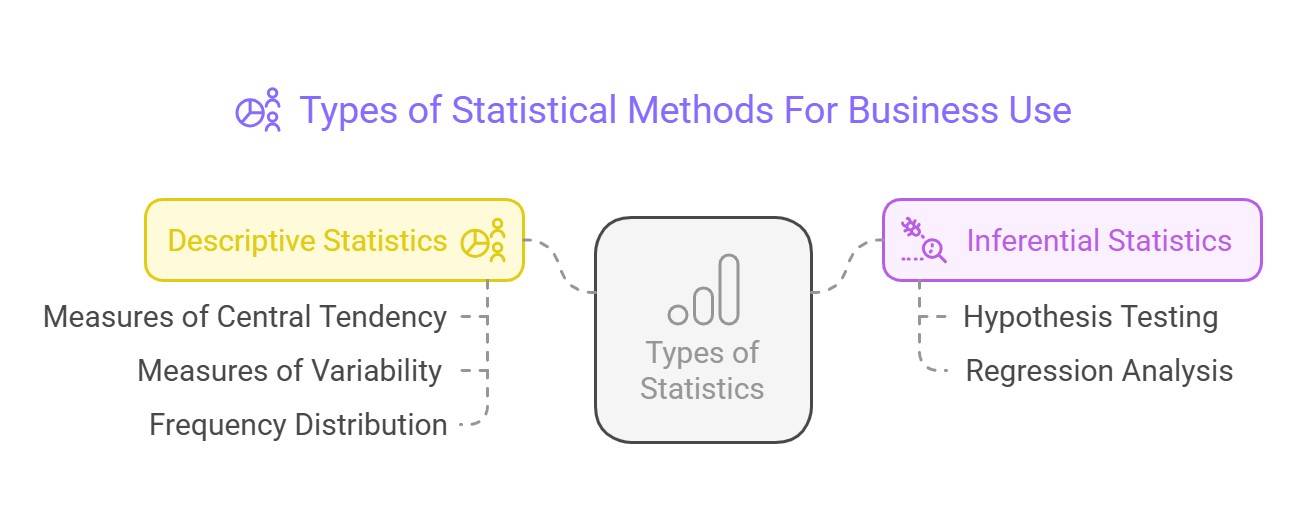
1. Descriptive Statistics
Descriptive Analysis answers the question ‘what happened’ by summarizing the past data. It is the process of describing samples and populations. A large amount of data is summarised into various valuable bits of information. It mainly emphasizes frequency distribution, central tendency, and data variability. In a frequency distribution, we record how often data occurs, central tendency shows the center point of data distribution, and variability of the set indicates its degree of disposition.
Central Tendency
Measures of central tendency calculate the median or average values of data sets, whereas measures of variability show the dispersion of data. These two methods utilize tables, bar graphs, and general discussions to help users understand the meaning of the evaluated data.
Measures of variability
Variability measures enable us to determine how dispersed a data set’s distribution is. For instance, while a measure of central tendency can provide a person with the average value for a group of data, it cannot characterize the distribution of the data within the set.
Frequency Distribution
Distribution (or frequency distribution) refers to the quantity of times a data point occurs. Alternatively, it is the measurement of a data point failing to occur.
2. Inferential Statistics
Inferential statistics is a statistical branch that employs analytical techniques to infer conclusions about a population from a sample of its members. It is the statistical method in which we “conclude,” whereas descriptive statistics “describes” data. In other words, you gather information and draw a judgment. Parameter estimation and hypothesis testing are the two essential topics. Inferential statistics aims to find conclusions about a population. Inferential statistics uses a statistic (such as the sample mean) from the sample data to conclude the population parameter (e.g., the population mean).
Hypothesis Testing
Hypothesis testing is a type of inferential statistics used to test hypotheses and draw conclusions about the population using accessible sample data. It entails creating a null and alternative hypothesis and then performing a statistical significance test. A conclusion is drawn based on the test statistic’s value, the critical value, and the confidence intervals. A hypothesis test has three possible outcomes: left, right, and two. The critical hypothesis tests used in inferential statistics are listed below.
- Z Test
- F Test
- T Test
- ANOVA Test
- Wilcoxon Signed Rank Test
- Mann- Whitney U Test


Regression Analysis
Regression analysis is used to estimate how one variable will change about another one. The most common regression technique in inferential statistics is linear regression. A linear regression calculates the effect of a unit change in the independent variable on the dependent variable. Regressions come in various forms:
- Basic linear
- Multiple linear
- Nominal
- Logistic
- Ordinal

Difference Between Statistical and Inferential Data
- Descriptive statistics provide details about the characteristics or descriptions of raw data. On the other hand, inferential statistics use data retrieved from the population to make judgments about the population.
- While inferential statistics explain the likelihood of an event, descriptive statistics describe a condition.
- Descriptive statistics aid in the meaningful organization, analysis, and presentation of data. Inferential statistics makes comparing data, generating hypotheses, and making predictions easier.
- Using descriptive statistics, previously known information about a specific sample or small population is explained. Inferential statistics aims to make inferences or conclusions about the entire population.
- Descriptive statistics are shown using graphs, tables, and charts, while inferential statistics are represented using probability approaches.
- Instead of using inferential statistics, which requires establishing a relationship between variables across the entire population, you can conduct a study more efficiently using descriptive statistics.
Conclusion
A decision may not always be right, even if statistics support it. Even while the data can point to a specific pattern or imply a specific outcome, any decision made using the data would only be correct if the data-gathering procedure or interpretation were correct. Because of this, the effects of every company choice ought to be periodically assessed and tracked. Hence, an individual should thoroughly understand all the methods to use statistics for business and make meaningful decisions successfully.
Top Trending Articles in Statistics:
Skewness In Statistics | Statistics Interview Question | Basics Of Statistics | Measure Of Central Tendency | Probability Distribution | Inferential Statistics | Measure Of Dispersion | Introduction To Probability | Bayes Theorem | P-Value | Z-Test | T-Test | Chi-Square Test | Outliers In Python | Sampling and Resampling | Regression Analysis In Machine Learning | Gradient Descent | Normal Distribution | Poisson Distribution | Binomial Distribution | Covariance And Correlation | Conditional Probability | Central Limit Theorem
Top FAQs on Statistics for Business
Why are statistics important in business?
Statistics help businesses make informed decisions by analyzing data trends, understanding market behaviors, and forecasting future performance. They support strategic planning and improve decision-making accuracy.
How can businesses use statistics to improve marketing strategies?
Businesses use statistics to analyze customer data, segment markets, and evaluate campaign effectiveness. This helps in targeting the right audience and optimizing marketing efforts for better results.
What role do statistics play in financial analysis?
Statistics are used in financial analysis to assess risks, forecast revenue, and evaluate investment opportunities. They provide insights into financial performance and help in making sound investment decisions.
How do businesses apply statistics in operations management?
In operations management, statistics are used for quality control, process optimization, and supply chain management. They help in identifying inefficiencies and improving overall operational effectiveness.
What are key statistical tools used in business analytics?
Key tools include regression analysis, hypothesis testing, and data visualization. These tools help in interpreting complex data, identifying trends, and making data-driven decisions.
