
Level of Detail(LOD) Expression in Tableau
 Call 8585951111
In this article, we will discuss about the Levels of Detail (LOD) expression in tableau, types of LOD expressions and how to create LOD expression in tableau.

Table of Content
- Why do we need LOD expression in Tableau?
- What are LOD expressions in Tableau?
- How to create LOD expression in Tableau
- Limitation of LOD
Firstly we will discuss why we need LOD expressions in the tableau or what problem we are trying to solve through LOD expressions then we will move to what are LOD expressions in the tableau.
Best-suited Tableau courses for you
Learn Tableau with these high-rated online courses

Why do we need LOD expression in Tableau?
Let’s understand the problem with the help of an example
In Sample Superstore data, using tableau we can easily find the details like:
- Maximum Sale/Profit/Discount of product
- Minimum Sale/Profit/Discount of product
- Highest selling product
- Least selling product
- State producing maximum profit
- Category of products
- Sub-category of products
But, what if we have to find:
- In which week of Q3 2018, did the company get the maximum/minimum order?
- In which quarter company makes the maximum profit?
- A number of days per quarter in which the company sells more than 50 products of each category?
To solve problems like this, LOD comes into action. In Tableau 9.0 LOD comes into action. It allows users to express powerful concepts using simple concepts.
Must Check: What is Tableau?
Must Check: Tableau Online Courses & Certifications
Now, let’s move on to know what LOD expressions are.
What are LOD expressions in Tableau?
The Level of Detail (LOD) expressions allow computing the value at the data source and the visualization level. It is a powerful technique to solve the problem that includes multiple levels of granularity in a single visualization.

They can be performed at:
- a more granular level (INCLUDE)
- a less granular level or (EXCLUDE)
- an entirely independent level (FIXED)

 Read Later
How to create LOD expression in Tableau?
There are three types of LOD expressions:
- FIXED
- INCLUDE
- EXCLUDE
Now, we will see how to create each LOD expressions
FIXED
- Compute value using the specified dimension, without reference to the dimension in the view
- Syntax: {[FIXED] <declaration of dimension> : <expression to aggregate>}
Example:
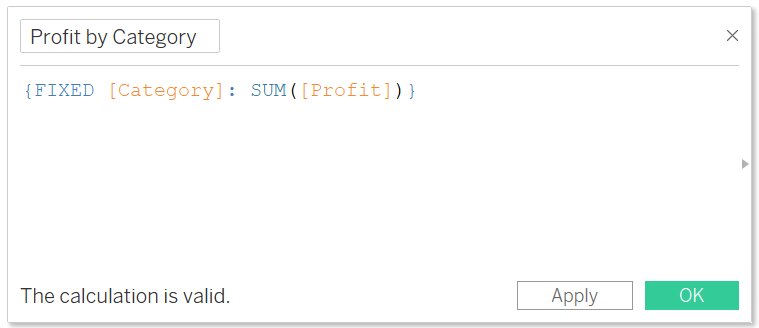
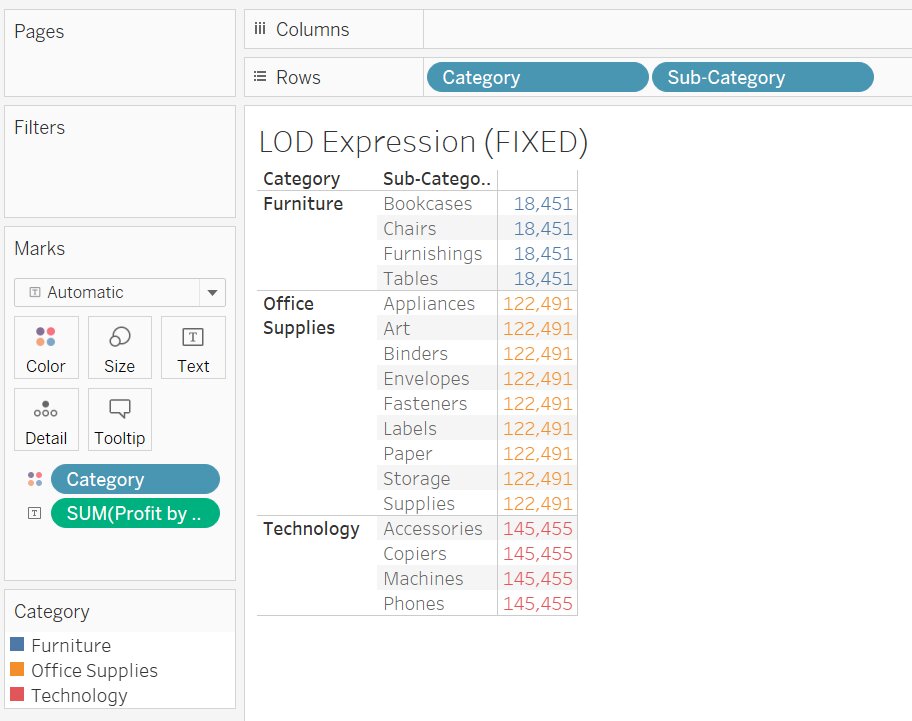
Problem Statement: Calculate the total Profit by Category without calculating for each sub-category present in the category.
Steps to Create:
- Connect the Sample Superstore Data
- Drag and Drop Category and Sub-category into the row shelf
- Drag and Drop Category into Color in the Marks Pane
- Analysis -> Create Calculated Fields
- Change the name Profit by Category
- Write the formula
- Drag and Drop Profit by Category to Text in Marks Pane


INCLUDE
- INCLUDE works just opposite FIXED
- It includes view dimensions in calculation i.e. it will include an additional dimension along with the one specified
- Fields based on INCLUDE LOD will change as you add or remove dimensions from the view.
- Syntax: {[INCLUDE] <declaration of dimension> : <expression to aggregate>}
Example:
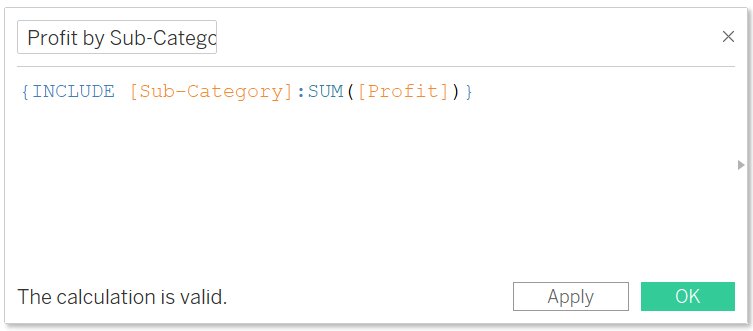
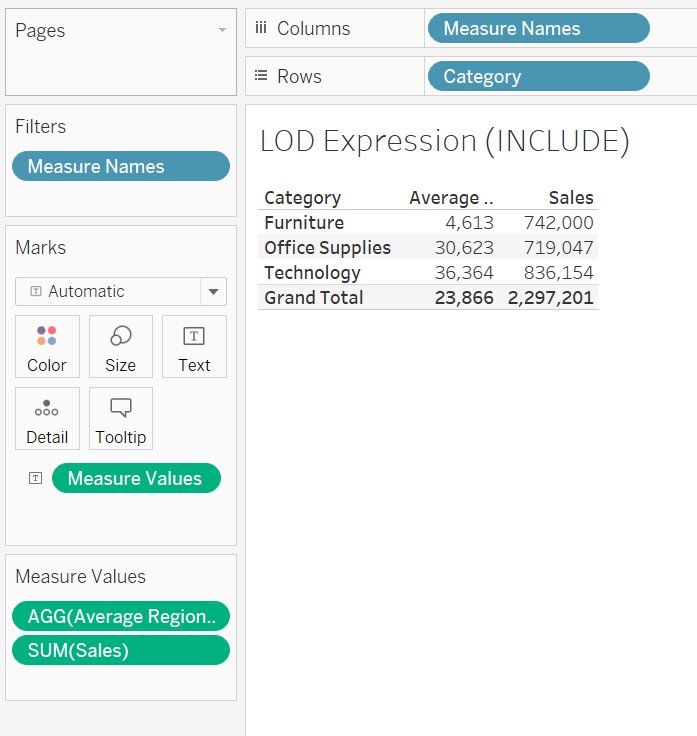
Problem Statement: Calculate the average regional profit for each category.
Steps to Create
- Connect to Sample SuperStore data
- Drag and Drop Category into the row shelf
- Analysis -> Create Calculated Fields
- Change the name Average Regional Profit
- Write the formula
Note: It is not mandatory to use the aggregation function in the formula, you can change it in Marks Pane -> Right-Click on selected Field -> Select Measure -> Select AVG
- Double Click on Average Regional Profit
EXCLUDE
- It is used to eliminate the dimension from lower granularity levels
- It calculates the dimension from the higher level of granularity
- Useful for ‘percentage of total’ or ‘difference from overall average’ scenario
- Syntax: {[EXCLUDE] <declaration of dimension> : <expression to aggregate>}
Example:
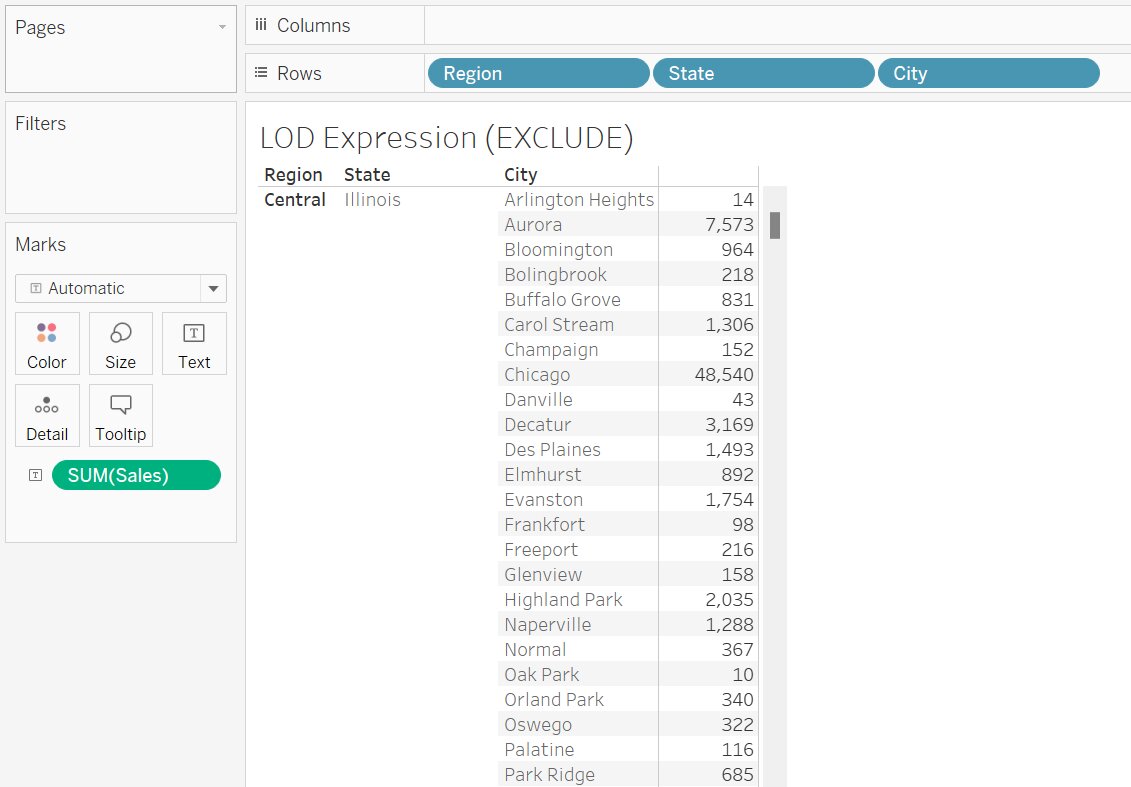
Problem Statement: Sales of the product are given on the basis of City, State and Region, now eliminate the City dimension when computing the sales.
Steps to Create
- Connect to Sample SuperStore data
- Drag and drop Region, State, and City into row shelf
- Drag and drop Sales into Text in Marks Pane
- Analysis -> Create Calculated Fields
- Change the name Exclude City Sales
- Write the formula
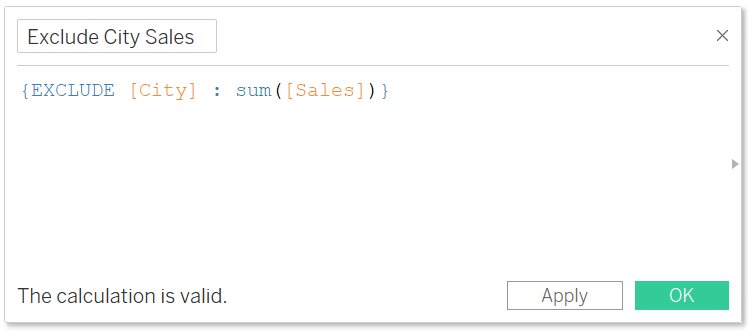
- Double click on Exclude City Sales
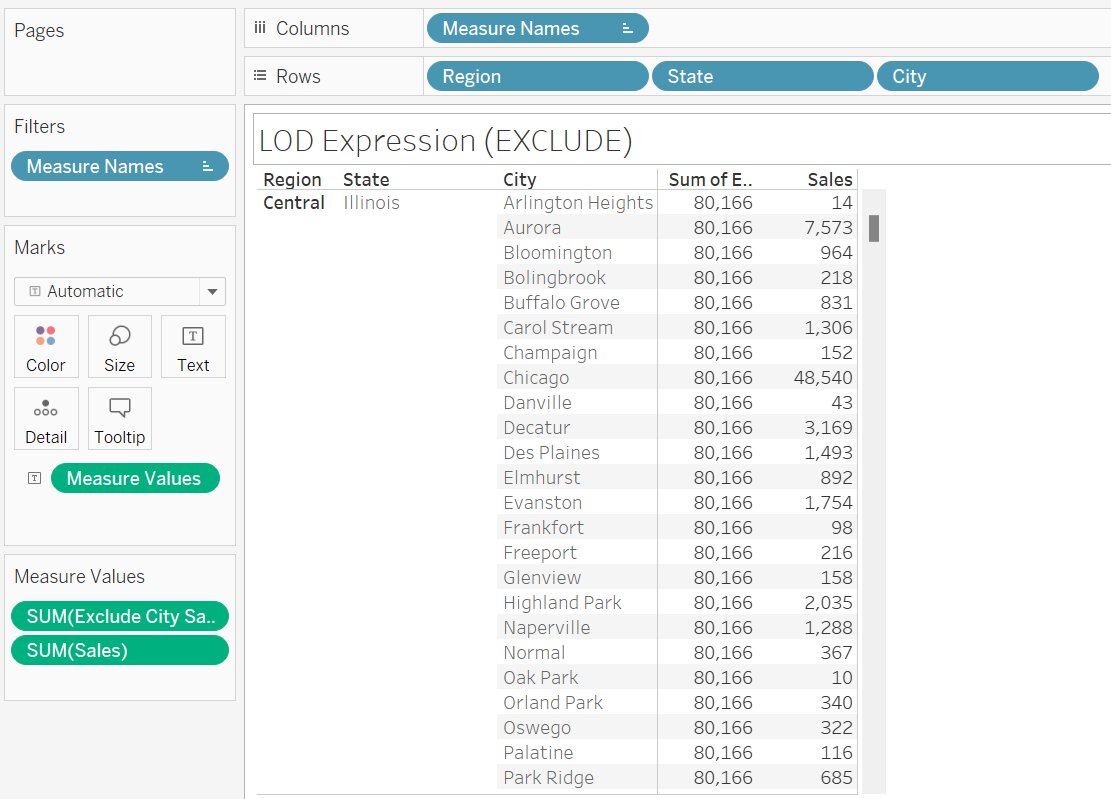
Now, the sales in computed only at State and Region levels.
Table-Scoped
LOD expressions can be defined at the table level without using any scoping keywords.
Example:
- {MAX([Profit])}
- returns maximum profit from the entire table
- {FIXED : MAX([Profit])}
- It is equivalent to FIXED LOD with no dimension declaration
Limitation of LOD expression
- Expressions are not shown on Data Source Page
- Table calculation can’t be used within a LOD
- It gives an unreliable view when floating values are used


Conclusion
In this article, we have discussed about the Levels of Detail (LOD) expression in tableau, types of LOD expressions and how to create LOD expression in tableau.
Hope this article will help you in your data analytics journey.
Top Trending Articles:
Introduction To Tableau |Products Of Tableau |Data Types In Tableau |Change Data Type In Tableau |File Type In Tableau |Data Aggregation |Connecting Data In Tableau |Dimension And Measure |Tableau Show Me |Joins In Tableau |Union In Tableau |Operators In Tableau |Number Functions In Tableau |String Functions In Tableau |Filter In Tableau |Context Filter In Tableau |Filters In Tableau |Types Of Charts In Tableau |Bar And Line Chart In Tableau |Pareto Chart In Tableau |Gantt Chart In Tableau |Box And Whisker Chart In Tableau |Waterfall Chart In Tableau |Donut Chart In Tableau |Funnel Chart In Tableau |Dual Axis Chart In Tableau |Sort Data In Tableau |Tableau Sets |Groups In Tableau |Tableau Hierarchy |Tableau Forecasting |Highlighting In Tableau |Word Cloud In Tableau |Cohort Analysis In Tableau

Comments