
 2 Videos,
Scranton Placements: Job Opportunities & Placement rate, Packages


- Private University
 58 acre campus
- Estd. 1888
 Talk to Expert
- University of Scranton Placement overview
- Scranton Average packages & top recruiters 2026
University of Scranton Placement overview
The University of Scranton records a placement rate of 98.5% for the year 2020 with a knowledge rate of 83%. The average salaries of undergraduates of the University of Scranton was USD 50,662 but for graduates the salary was recorded to be USD 73,601.
The median salary was recorded to be USD 56,225 which is the average of undergraduate and graduate median salary. There were over 250+ employers who employed University of Scranton graduates and the overall internship rate was also 98%.
Check: Study Guide to USA for International Students
University of Scranton Placement Highlights
|
Overall Placement Rate |
98.5% |
|
Knowledge Rate |
83% |
|
Average Salary |
USD 50,662 |
|
Median Salary |
USD 50,000 |
|
Salary Range |
USD 20,000 - USD 184,000 |
|
Total Employers |
250+ |
|
Internship Rate |
98% |
|
Highest Recruitment Geographically |
Pennsylvania: 70% |
|
Graduates Continuing Education |
23% |
Read: Cost of Studying in the US
University of Scranton Class Profile 2020
Total student population, including undergraduate, adult, part-time and graduate students, was 4,672 in the year 2020 for the Fall session of the University of Scranton. The number of female students were more than the male students, that is, female students accounted for 58% of the total composition and only 42% of them were male students.
Academic Details:
- Average GPA was 3.48
Regional Background:
- Pennsylvania: 42%
- New Jersey: 27%
- New York: 24%
- Others: 7%
College Wise Enrollment Numbers:
- College of Arts & Sciences: 1,624
- Arthur J. Kania School of Management: 1,247
- J.A. Panuska, S.J., College of Professional Studies: 1,758
- No School Affiliation: 63
University of Scranton Career Outcomes
The career outcomes survey of the University of Scranton were recorded level wise for the year 2020, the following infographic throws more light on the outcomes and the percentages recorded:
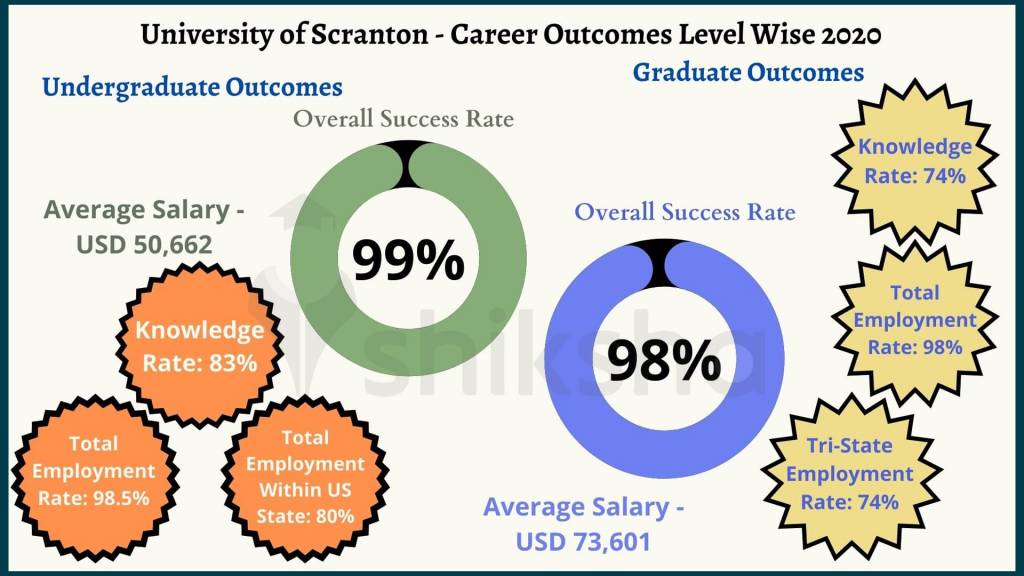
As per the career outcomes survey of 2020, the following stats were recorded for undergraduates and postgraduates of University of Scranton:
|
Career Outcomes |
Undergraduate |
Postgraduate |
|---|---|---|
|
Employed Full Time |
50% |
92% |
|
Employed Part Time |
3% |
3% |
|
Seeking Employment |
1% |
2% |
|
Continuing Education |
45% |
1% |
|
Other* |
1% |
2% |
*Note: ’Other’ is one of those career plans which includes travelling, taking a gap year before pursuing education / employment goals, etc.
Read: Working in US as an international student
Higher Education
Geographically, 80% of the recent undergraduates were employed in the tri-state - New York, New Jersey, Pennsylvania areas, while 74% of the postgraduates were employed in the tri-state area. Highest recruiting areas including the tri-state were:
- New York:
-
- Undergraduates Employed: 80-99
- Graduates Employed: 55-84
- New Jersey:
- Undergraduates Employed: 60-79
- Graduates Employed: 25-54
- Pennsylvania:
- Undergraduates Employed: 100-120
- Graduates Employed: 85-115
There were other states of the US like - Texas, Arizona, California, Vancouver, Miami, Illinois, Ohio, etc which recorded less than 10 recruitments for both undergraduates and graduates of the University of Scranton.
Read: Popular Job Sectors in US
College Wise Career Outcomes
There are three prominent colleges of the University of Scranton which offer various academic programs. The career outcomes recorded for each of the colleges are summarised in the table below:
|
University of Scranton Colleges |
Employed FT + PT |
Continuing Education |
|---|---|---|
|
College of Arts & Sciences |
47% + 4% |
45% |
|
Kania School of Management |
69% (FT) |
27% |
|
Panuska College of Professional Studies |
41% + 1% |
57% |
Top Universities Admissions
Other than the University of Scranton, there were 42 other universities which offered the graduates of class of 2020 admission for higher education. The top 5 universities with maximum admits in 2020 are as follows:
University of Scranton Average Salaries
The salary range was recorded at USD 20,800 - 105,000 for undergraduates and between USD 31,200 - 184,000 for postgraduates. The average starting salaries, major wise have been given below in the table, divided based on the levels also along with the number of students reporting these numbers:
|
Majors of University of Scranton |
Average Starting Salaries |
Total Reportees |
|---|---|---|
|
Undergraduates |
||
|
Accounting |
USD 53,209 |
12 |
|
Biology |
USD 39,448 |
5 |
|
Business Administration |
USD 41,180 |
6 |
|
Computer Science |
USD 75,000 |
2 |
|
Electrical Engineering |
USD 58,264 |
3 |
|
Finance |
USD 49,890 |
11 |
|
Health Administration |
USD 41,850 |
3 |
|
Marketing |
USD 40,380 |
5 |
|
Neuroscience |
USD 29,120 |
3 |
|
Nursing |
USD 62,943 |
31 |
|
Psychology |
USD 29,640 |
2 |
|
Graduates |
||
|
Clinical Mental Health Counselling |
USD 51,700 |
4 |
|
Educational Administration |
USD 55,429 |
7 |
|
Health Administration |
USD 57,501 |
14 |
|
Nurse Anaesthesia |
USD 172,627 |
8 |
|
Occupational Therapy |
USD 71,849 |
8 |
|
Physical Therapy |
USD 69,667 |
3 |
|
Special Education |
USD 49,000 |
2 |
The median salary recorded for undergraduates of University of Scranton was USD 50,000 while for graduates it was USD 62,450.
Check: University of Scranton Courses
Annual Average Starting Salary Comparison
If we talk about the year wise salary analysis for both levels of study of University of Scranton, it can be noted that stark differences were marked, read on below for more details:
Undergraduates - Salary Comparison
- 2015 salary was recorded at USD 51,955.
- 2016 salary was recorded at USD 52,018.
- 2017 salary was recorded at USD 51,446.
- The 2018 salary was recorded at USD 51,282.
- The 2019 salary was recorded at USD 54,766.
Graduates - Salary Comparison
- In the year 2015 the salary was recorded at USD 71,634.
- While in the year 2016 the salary was recorded at USD 70,911.
- In 2017 the salary was recorded at USD 72,124.
- The 2018 salary was recorded at USD 62,571.
- In the year 2016 the salary was recorded at USD 69,494.
ScrantonAverage packages & top recruiters 2026
ScrantonExplore courses from similar popular universities
Scranton
Student Forum
Answered a year ago
Yes, applicants must submit one letter of recommendation duly signed by a school counsellor of an recognised institution as part of the application.
Students can upload the LOR via the Common Application Portal or ask their teachers to do the same on their behalf.
A
Contributor-Level 10
Answered a year ago
The most notable Indian to have pursued their higher studies at University of Scranton is Kalanithi Maran, an Indian media proprietor, chairman & founder of the Sun Group.
Maran owns a number of TV channels, newspapers, weekly magazines, radio stations, DTH services as well as the IPL team: Sunrisers
A
Contributor-Level 10
Answered a year ago
As per data curated from an unofficial source, the University of Scranton has a retention rate of around 87%, that acts as a good indicator of student satisfaction.
Students are exposed to some of the best infrastructural facilities & also get ample opportunities to grow their network via boot camps,
A
Contributor-Level 10
Answered a year ago
As per the latest employment data (Class of 2023) made available by the university, the University of Scranton employment rate for Graduate students stands at 100% from a knowledge rate of 72%.
While the placement rate for UG students stands at 99% at a knowledge rate of 85%, highlighting the standar
A
Contributor-Level 10
Answered 2 years ago
University of Scranton offers many interesting and rewarding employment opportunities for students, including event assistants, work-study positions, and peer tutoring. Students can find open positions on the university's website or by contacting vendors such as Aramark and Follett directly.The Univ
S
Contributor-Level 9
About the author

Scranton
") Memorial library
Memorial library") Science Building
Science Building") Byron Center
Byron Center")
")


ScrantonLocation
| University City | Scranton, Pennsylvania, USA |
ScrantonContact Information
800 Linden St, Scranton, PA 18510, United States
Scranton ( Pennsylvania)

Comments