


You need to describe visual information like line, bar, pie or table, chart, map or diagram in the IELTS exam Writing Task 1. Summarise only the main trends and features.
- Why Line Charts Can Be Challenging?
- Proven Methodology to Tackle IELTS Writing Task 1 Line Charts
- Step 1: Analyze the Chart
- Step 2: Identify Main Features
- Step 3: Plan Your Response
- Step 4: Write the Response
- Step 5: Review and Refine

Why Line Charts Can Be Challenging?
Line charts show trends or changes over time. Sometimes there one line, sometimes many lines. The tricky part is:
- Finding trend: Is it going up, going down, or going up and down?
- Important points: What is highest or lowest point? When lines meet or go apart?
- Using right words: You need vocabulary and grammar for changes like increase, decrease, rise, fall, fluctuate, peak, bottom out.
- Clear order: A simple structure help you get high score.
Proven Methodology to Tackle IELTS Writing Task 1 Line Charts
I will teach you my way to do IELTS Writing Task 1 Line Charts. It’s simple 5-step method:
- Look chart careful: First, try understand what graph showing.
- Pick main features: Find most important details to write about.
- Plan answer: Make small structure before writing.
- Write response: Use right vocabulary and grammar to say changes.
- Check fix mistakes: Read again and correct mistakes if any.
This way you can do IELTS Writing Task 1 easier and faster.
Step 1: Analyze the Chart
Let's consider an example and apply these steps.
Example Line Chart:
I'll create a simple line chart for this explanation. I'm simulating this chart since I cannot create actual visuals.
Title: Internet Usage (in millions) in Three Different Age Groups in the UK Between 2010-2020
Data (Simulated):
| Year | 18-25 | 26-45 | 46+ |
|---|---|---|---|
| 2010 | 25 | 30 | 10 |
| 2012 | 35 | 40 | 18 |
| 2014 | 45 | 50 | 25 |
| 2016 | 55 | 60 | 35 |
| 2018 | 60 | 70 | 45 |
| 2020 | 65 | 75 | 55 |
Here is how the chart will look like:
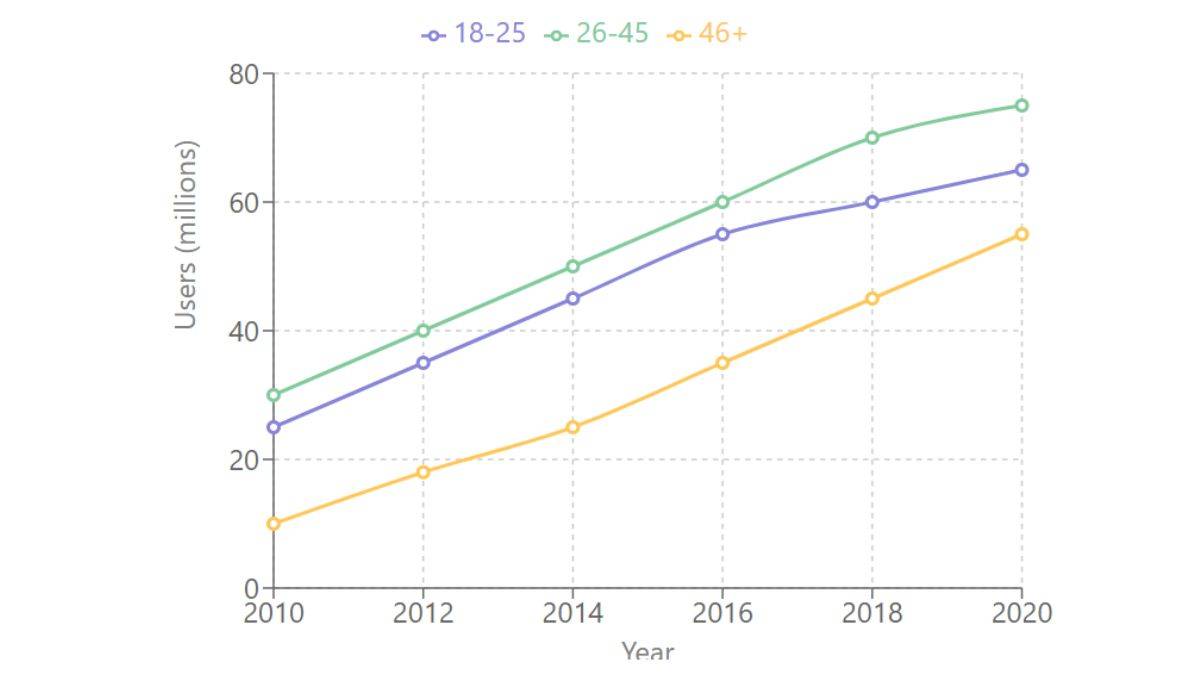
Line Chart Internet Usage
Analysis:
-
What is it about? Internet Usage Trends
-
What is being measured? Internet usage in millions.
-
Who is being measured? Three age groups: 18-25, 26-45, and 46+.
-
Over what time period? Between 2010 and 2020.
-
Overall trend: General increase in all age groups.
-
Key Differences: The 26-45 age group consistently used the internet the most, followed by the 18-25 age group, with the 46+ group using it the least.
Step 2: Identify Main Features
Overall Trend:
- All three age groups show more internet usage over 10 years.
- The growth speed little bit different for each group.
Specific Features:
- The 26-45 age group start with most internet usage and keep it all time.
- The 18-25 age group grow much, later more internet usage than 46+ group.
- The 46+ age group climb slow but still lowest internet usage every year.
Step 3: Plan Your Response
- An introduction of 1 to 2 sentences
- An overview of 2 to 3 sentences
- Body Paragraph 1 of 4 to 5 sentences
- Body Paragraph 2 of 4 to 5 sentences
Step 4: Write the Response
Here's example of how you can structure your response when describing a line chart.
Introduction Part:
The line chart shows changes in internet usage for three age groups in UK.
Overview Section:
- Overall, internet usage went up for all three age categories during this period. That's the main trend you needs to mention.
- The 26-45 age group had highest usage consistently throughout the decade. Meanwhile, 46+ age group showed lowest numbers all the time.
Body Paragraph 1:
- The 26-45 age group started with 30 million initially.
- The 18-25 age group began at 25 million users, while 46+ age group had only 10 million at start.
- By 2014, things changed quite bit. Internet usage for 26-45 age group climbed to 50 million already.
- The 18-25 age group wasn't far behind at 45 million. And the 46+ age group increased to 25 million users by then.
Body Paragraph 2:
- The trend continued going upward after that. By 2020, usage for 26-45 age group peaked at 75 million which was highest point.
- Similarly, internet usage for 18-25 age group ascended to 65 million. Pretty significant growth right?
- The 46+ age group reached 55 million users in 2020. Although there was growth for oldest age group, it remained lowest in terms of internet usage over the ten years consistently.
Step 5: Review and Refine
Check Grammar and Spelling:
Make sure your sentences is grammatically correct. No spelling mistakes should be there in your writing.
Check for Clarity:
Does the information flows logically? That's important question to ask yourself. Your ideas needs to connect smoothly.
Check Word Count:
- You should stay within the word limit always. Aim for about 150-180 words - not below that.
- Going under the minimum word count can hurts your score, so be careful about this.
 Statement of Purpose
 Letter of Recommendation
 Student Visa Application
 Admission Essay Writing
 Student Curriculum Vitae
Comments
(1342)
5 months ago
L
6 months ago
L
6 months ago
S
6 months ago