

In IELTS Writing Task 1 tests a table chart question which is an important topic for this section. The IELTS Writing Table Chart is a part of Task 1 and is basically a visual presentation that depicts the data in a tabular format including multiple rows and columns — highlighting significant data sets. The IELTS Writing section's Table Chart is supposed to be summarised in a formal report format and applicants can include points like trends, highest and lowest points, and making comparisons where relevant is essential while analysing and compiling data in an essay. IELTS Writing Table Chart Task 1 tests applicants' ability to logically analyse data and compare significant data sets by comparing them in words. This task of IELTS Writing - Task 1 has to be written in a maximum of 150 words in 20 minutes. There are different types of table charts tested on the IELTS exam and all of them have been discussed in detail along with Table Chart Task 1 on IELTS Writing scoring and assessment criteria in the article below.
For more info. on how to register for IELTS Exam, the latest guidelines, IELTS Exam Date, feel free to check out the IELTS exam details on Shiksha.com.
IELTS Task 1 Table Charts Format
The Table Chart is one of the report writing tasks in IELTS. In this type of figure, the data is presented vertically and horizontally, and there is a header to help candidates understand the category division. This task is generally of two types: with time or without time.
Types of Table Charts in IELTS Writing Task 1
The data of a "Table Chart" on IELTS Writing Task 1 can be given in the following formats in the question paper:
| Type of Table Charts on IELTS Writing Task 1 | Table Charts Description |
|---|---|
| 1. Single Table Comparison | Compares different categories or periods within the same context. |
| 2. Multiple Table Comparison | Requires comparisons among data sets from two or more tables. |
| 3. Hierarchical Table | Break down data into subcategories for analysis at different levels of detail. |
| 4. Table and Chart Combination | Combines tabular data with visual representations like graphs or pie charts for enhanced understanding. |
Thus, there are four formats in which IELTS Writing - Table Charts can be tested. Applicants must note that only one type of table chart will be tested on Task 1 and not all types, but applicants must practice all the above-mentioned types before going for the IELTS exam.
IELTS Writing Task 1 Table Chart - Steps for Approaching
Step 1: Understand the Question and Task
Before attempting the question, read and analyse what are the requirements.
- Identify the table presented, whether it is a table of time or no time.
- Pay attention to the header consisting of the categories and carefully check the units.
Step 2: Planning the Response
After analysing, it is essential to plan your response.
- In the Table of Time, content includes base, trend, highest and lowest points.
- Howvever, in the Table of No Time, add content using variations.
Step 3: Writing about the Task
The content of the report needs to be divided into a three-paragraph structure.
- Introduction paragraph provides the paraphrasing and the overview of the task.
- Overview includes the highest or the dominating category excluding the numbers/time.
- The Body paragraphs include the content of the table given, highlighting the comparison where relevant.
Note - The structure remains same, irrespective of the format of the table.
You can now refer to the model answer for the IELTS Writing Task 1 Table Chart, with a band score of 5.5 with a 8, along with the expert’s comments.
IELTS Writing Task 1 - Table Chart Example
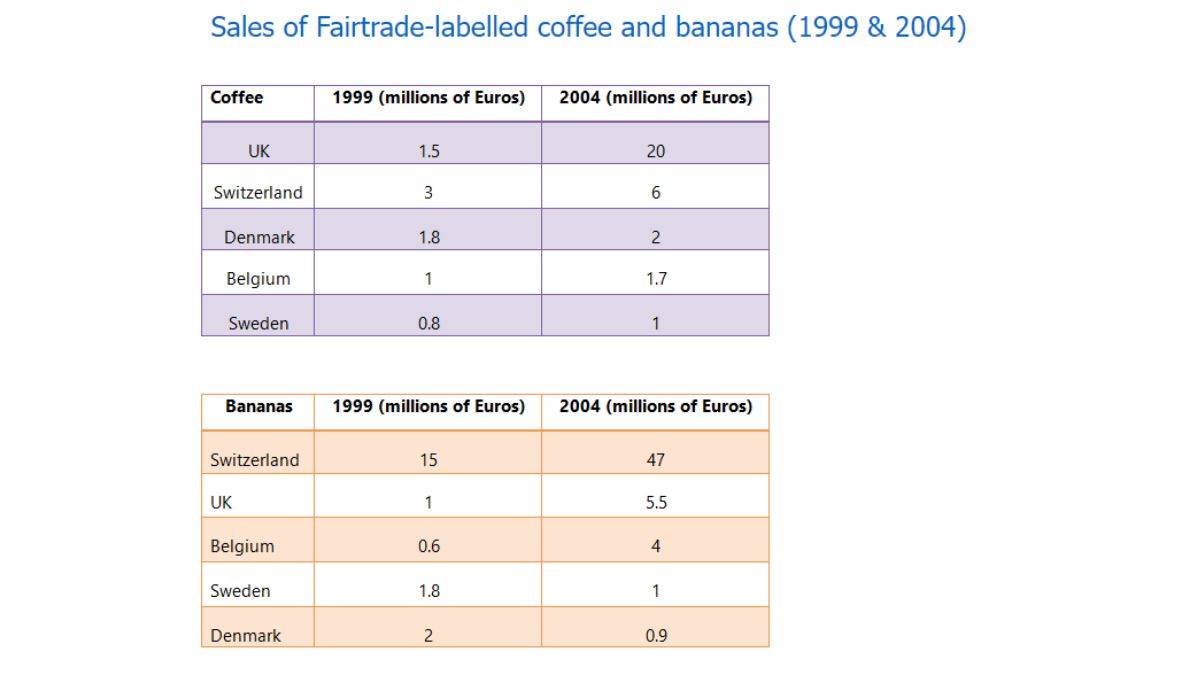
The tables below give information about sales of Fairtrade-labelled coffee and bananas in 1999 and 2004 in five European countries.
Summarise the information by selecting and reporting the main features, and make comparisons where relevant.
Write at least 150 words in 20 minutes.
First Thing is to Understanding the Task
-
Task Type: Table Chart
-
Objective: To compare the sales of Fairtrade-labeled coffee and bananas in five European countries in 1999 and 2004.
-
Key Actions:
-
Summarize the main trends and features of each table.
-
Make relevant comparisons between the countries and products.
-
Highlight significant changes or differences over the period.
-
Write a clear and concise report with appropriate vocabulary and grammar, ensuring you write at least 150 words.
-
Key Elements to Focus On
-
Overall Trends: Note the general sales increases or decreases for each product between 1999 and 2004.
-
Coffee Sales:
-
Identify which countries had the highest and lowest sales.
-
Note any significant changes in coffee sales.
-
-
Banana Sales:
-
Identify countries with the highest and lowest sales.
-
Note any major changes or differences from coffee sales.
-
-
Comparisons: Compare the sales of coffee versus bananas in different countries and over the two years.
IELTS Task 1 Table Chart Vocabulary, Language & Grammar
In Table Chart 1 task of Writing, you are required to brief data to meet requirements of task. Use ideal vocabulary and correct grammar to achieve success in exam.
IELTS Task 1 Table Chart Vocabulary to be used:
- If describing a trend, then use increase, decrease, fall, dip, soar.
- If talking about degree of change, use dramatically, drastically, considerably, moderately.
- When comparing data, use more than, less than, equal to, half of.
- Differences/Similarities - whereas, while, likewise, similarly.
- Indicating time - throughout, during, over the period.
IELTS Task 1 Table Chart FAQs
Q: What kind of information do I need to write about in IELTS Task 1 Table Chart?
A: The IELTS Task 1 Table Chart should have basic information which includes figures and trends followed by comparisons.
Q: How much detail should I include in Task 1 IELTS Table Chart?
A: In Task 1 of IELTS Writing, it is never required to elaborate every single point. It is essential to specify the overall trends and similarities in the data. It is essential to meet the word limit. The same rule applies to IELTS Task 1 Table Chart questions.
Q: Can I use my own opinion while attempting Task 1 IELTS table chart?
A: No, applicants cannot share their opinions while forming IELTS Table Chart report. Avoid stating opinions or personal beliefs. No reason or over-detailing should be included in the response.
Comments
(1341)
2 months ago
L
3 months ago
L
3 months ago
S
3 months ago
S
3 months ago