

Bar charts are one of visual type tasks in Writing Task 1 of IELTS exam. Bar charts use bars of different lengths to show data. These charts can be vertical or horizontal, single or grouped and your task is to summarise key features objectively.
Key Challenges with Bar Charts:
-
Comparing Categories: Identifying the highest and lowest categories and making comparisons.
-
Grouped Bar Charts: Understanding and comparing multiple categories or groups within each category.
-
Using Appropriate Language: Employing a variety of language to make comparisons, describing quantities and differences between the bars.
-
Summarizing Main Features: Selecting the essential details without listing every single value.
Methodology for dealing with Bar Charts in IELTS Writing
The 5-step process is still applicable but with a focus on comparisons:
-
Analyze the Chart: Understand the chart type and what it represents.
-
Identify Main Features: Note the key comparisons between categories.
-
Plan Your Response: Create a structure that prioritizes comparison.
-
Write the Response: Use specific language to describe and compare categories.
-
Review and Refine: Proofread and check your writing.
Step 1: Analyze the Chart
Look at the bar chart example below.
Title- Number of Books Read Annually in Four Different Countries - 2023
Simulated Data -
| Country | Number of Books Read |
| Country A | 15 |
| Country B | 25 |
| Country C | 10 |
| Country D | 30 |
Here is how the bar chart visually looks like-
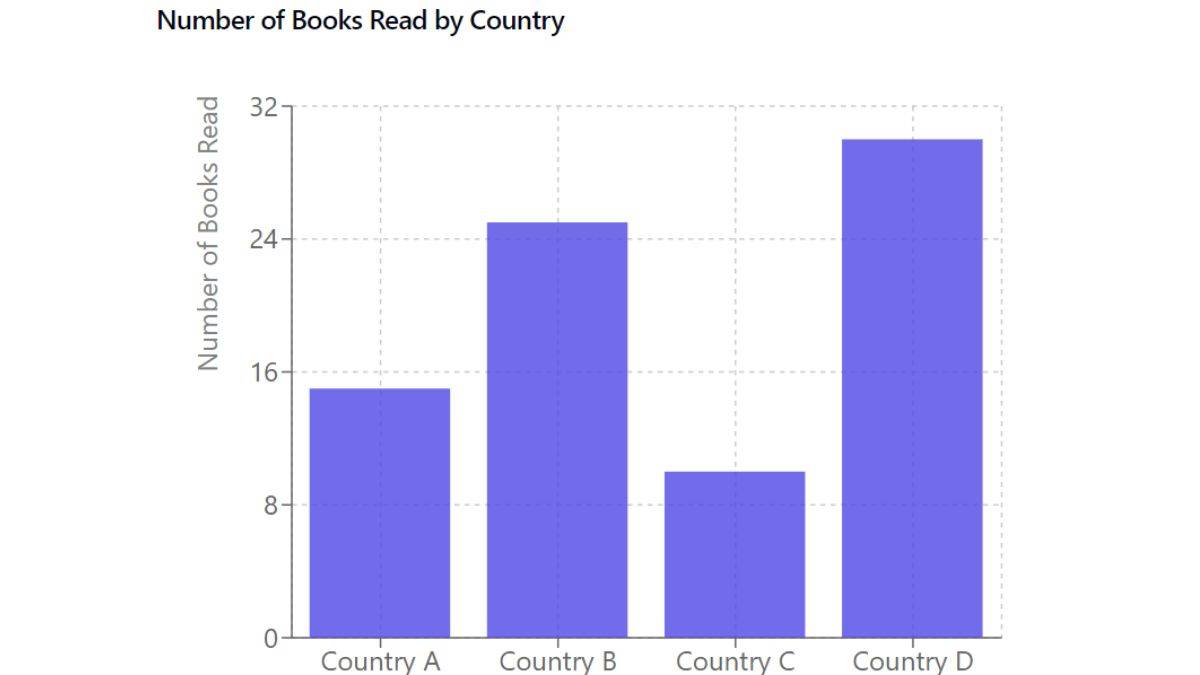
IELTS Bar Chart
| IELTS Bar Chart Analysis | |
|---|---|
| Question | Answer |
| What is this bar chart about? | number of books read per year |
| What is being measured in this bar chart? | Number of books read |
| Who is being measured in this bar chart? | People in 4 diff. countries |
| Over what time period? | 2023 |
| comparisons | Country D read the most books, country C read the least and other countries had number between the two. |
Step 2: Identify Main Features
-
Overall View-
-
The bar chart provides a snapshot of number of books read in four different countries in 2023
-
There is noticeable difference in number of books read across different countries
-
-
Specific Features-
-
People from D country read the highest number of books, i.e. 30
-
People from C country read lowest number of books - 10.
-
People from country A & B country read 15 & 25 books respectively.
-
Step 3: Plan Your Response
Logical structure for IELTS Writing bar chart includes-
-
Introduction- 1-2 sentences
-
Overview- 2-3 sentences
-
Body Paragraph- 1 4-5 sentences
Step 4: Write the Response
Here's an example response based on the plan-
Introduction-
Bar chart presents data on quantity of books read annually by people in four distinct countries in the year 2023.
Overview-
Overall there were considerable variations in the amount of books read across the four countries. Country D recorded highest reading figures whilst Country C had lowest.
Body Paragraph 1-
As shown in bar chart, population in Country D read highest number of books with 30 in 2023. In contrast, people in Country C read least, averaging only 10 books per year.
Important Vocabulary-
-
Comparison- compared to, in contrast, whereas, while, by comparison, significantly higher/lower, notably, relatively
-
Quantities- highest, lowest, small number, large number, moderate number, significant amount
-
Describing values- approximately, nearly, slightly more/less than, precisely
-
General statements- overall, in general, generally, as can be seen, it is evident
Example of a Grouped Bar Chart-
Let's say above chart was grouped chart showing book reading trends across different age groups within these countries. Let's add some hypothetical data-
Title- Number of books read annually by different age groups in four countries in 2023
| Country | Age Group (18-30) | Age Group (31-50) | Age Group (51+) |
|---|---|---|---|
| Country A | 18 | 12 | 10 |
| Country B | 28 | 25 | 22 |
| Country C | 12 | 10 | 8 |
| Country D | 32 | 30 | 28 |
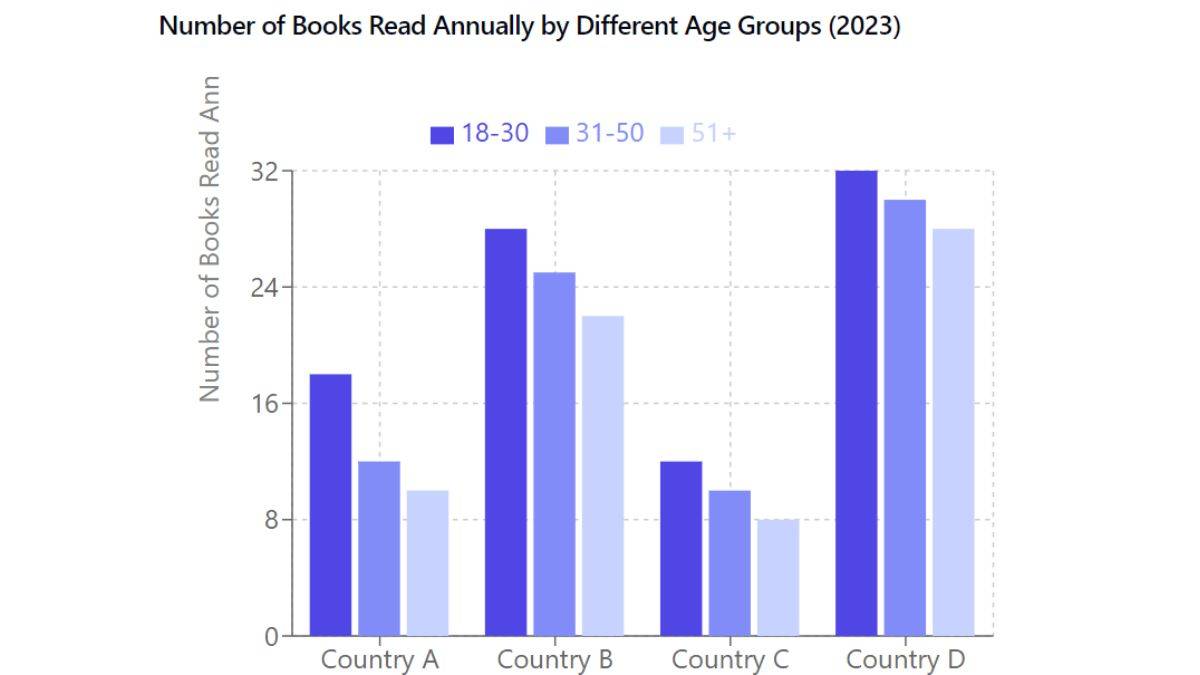
Grouped Bar Chart
Analysis-
-
Now we have comparisons within each country for different age groups.
-
Country D still reads most overall but we see that reading decreases within age groups from youngest to oldest.
Revised Body Paragraph Example for Grouped Chart-
Bar chart reveals that within each country - 18-30 age group read most books; followed by 31-50 age group - with the 51+ age group consistently reading least. In Country D - 18-30 year olds read 32 books, 31-50 year olds read 30 and 51+ read 28. Country A showed similar pattern with 18,12 and 10 books read while country B's reading habits were 28, 25 and 22 books respectively. Country C showed overall lowest readings with groups reading 12, 10 and 8 books.
Step 5: Review and Refine
This will follow the same process as we discussed under line chart-
-
Make sure your sentences are grammatically correct.
-
Does information flow logically?
-
Ensure you're following word limit.
-
Ensure you are not using same words or phrases repeatedly.
Tips for Bar Charts-
-
Use language that highlights the differences between categories.
-
Summarise the main points without listing every single value.
-
Use a range of comparative and descriptive terms.
-
Practice with single and grouped bar charts.
Comments
(1341)
2 months ago
L
3 months ago
L
3 months ago
S
3 months ago
S
3 months ago