

Class 12th
Get insights from 11.9k questions on Class 12th, answered by students, alumni, and experts. You may also ask and answer any question you like about Class 12th
Follow Ask QuestionQuestions
Discussions
Active Users
Followers
New answer posted
11 months agoContributor-Level 10
From the table given in the question,
Total student = 800
Students in Secondary = 0.8 * 800 = 640
Students in Class 11 = (800 – 640)/2 = 80
Student in Class 12 = 80
Females in Class 11 = 0.55 * 80 = 44
Females in Class 12 = 0.6 * 80 = 48
Females in Secondary = 0.475 * 800 – 44 – 48 = 288
Non-vegetarian in Class 11 = 0.5 * 80 = 40
Non-vegetarian in Secondary = 0.55 * 640 = 352
Non-vegetarian in Class 12 = 800 * 0.53 – 40 – 352 = 32
The percentage of non-vegetarian in class 12 = 32 * 100/80 = 40%
New answer posted
11 months agoContributor-Level 10
|
| July |
|
| Aug |
|
| Sep |
|
| Oct |
|
| Nov |
|
| Dec |
|
Cities | Max | Min | Avg | Max | Min | Avg | Max | Min | Avg | Max | Min | Avg | Max | Min | Avg | Max | Min | Avg |
Ajmer | 12.0 | 4.0 | 5.6 | 14.0 | 7.0 | 11.2 | 19.0 | 10.0 | 14.5 | 25.0 | 10.0 | 17.5 | 29.0 | 12.0 | 23.9 | 31.0 | 14.0 | 25.9 |
Ayodhya | 6.0 | 1.0 | 2.0 | 8.0 | 3.0 | 6.0 | 10.0 | 5.0 | 7.5 | 14.0 | 9.0 | 11.5 | 16.0 | 11.0 | 14.5 | 19.0 | 14.0 | 17.5 |
Mathura | 20.0 | 12.0 | 13.6 | 24.0 | 13.0 | 19.6 | 29.0 | 17.0 | 23.0 | 36.0 | 21.0 | 28.5 | 38.0 | 24.0 | 33.8 | 41.0 | 27.0 | 36.8 |
Kashi | 13.0 | 7.0 | 8.2 | 16.0 | 10.0 | 13.6 | 19.0 | 14.0 | 16.5 | 21.0 | 16.0 | 18.5 | 24.0 | 18.0 | 22.2 | 26.0 | 21.0 | 24.5 |
New answer posted
11 months ago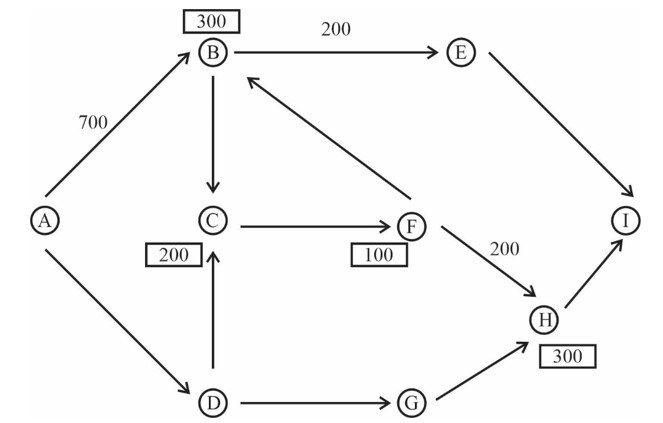
Contributor-Level 10
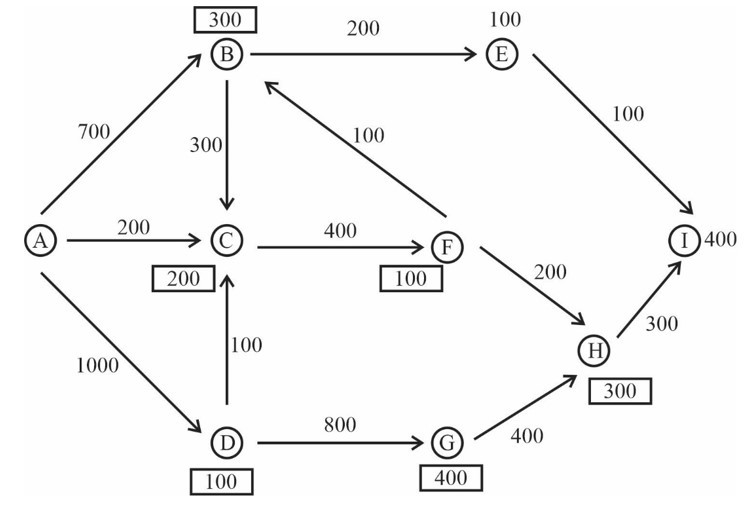
As not two pipelines connecting same place are carrying same amount, and at least one of the pipelines should carry same as that of the place, either H-I or G-H must carry 300. If G-H carries 300, then H-I must carry 200, which is not possible.
H-I must carry 300 and G-H must carry 400. D-G should carry 400 more than the requirement at G.
G's requirement must equal that of G-H
Requirement at G = 400 D-G = 800
The flow in El must be equal to the requirement at E, and each of them must be equal to 100. Therefore the requirement at I = 100 + 300 = 400.
Considering F, the flow in FB must be equal to the requirement at F, i.e., 100, and the flo
New answer posted
11 months agoContributor-Level 10
Son | Color of shirt | Likes |
A | yellow | writing |
K | white/blue/green | singing |
S | red | traveling |
R | blue/white | reading |
N | green/white | playing |
New answer posted
11 months ago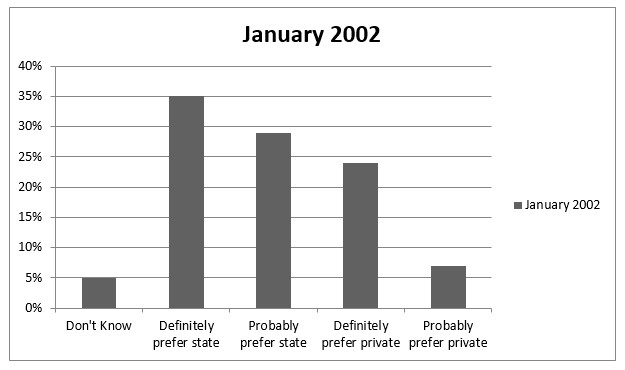
Contributor-Level 10
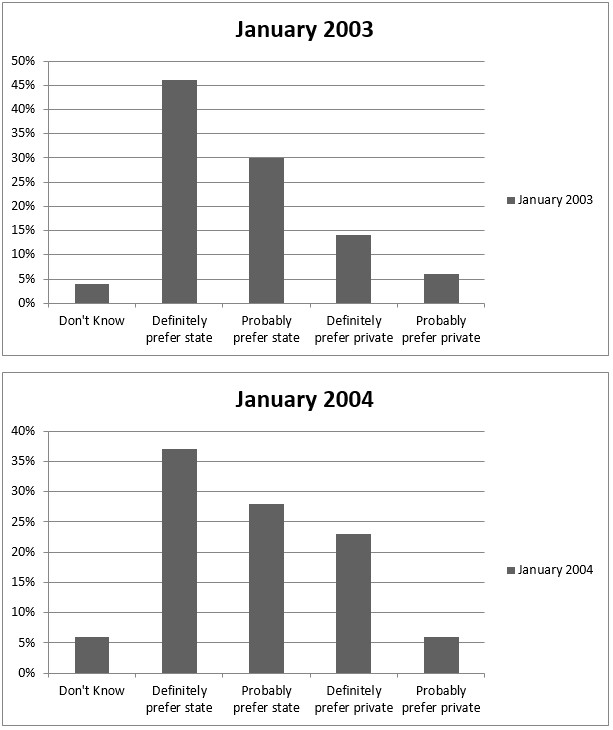
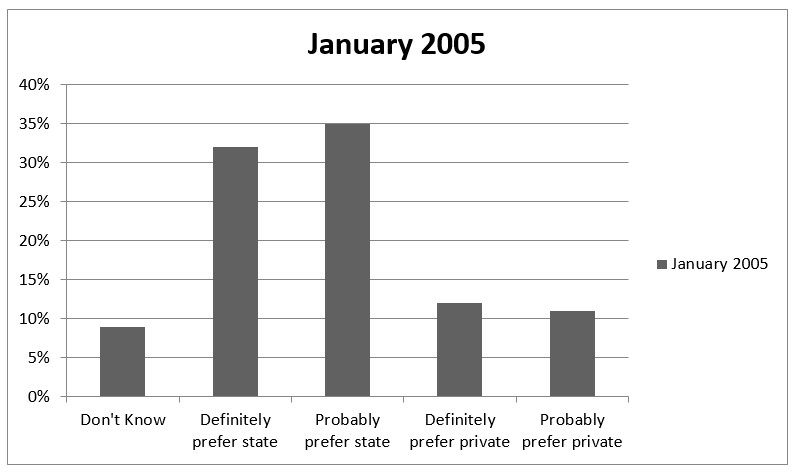
Using the reverse of the above condition you can see that the actual percentage voting for each one of the options increased in at least one of the years, Hence, none of the options saw a continuous decrease over the period.
New answer posted
11 months agoContributor-Level 10
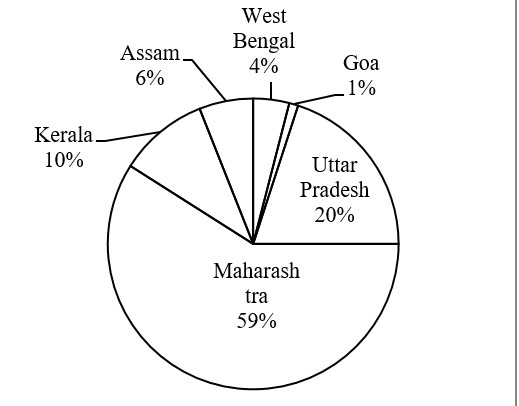
4% of India's crops in 2017-18 = 3625,
India's export = 3625 * 25 = 90625
New answer posted
11 months agoContributor-Level 10
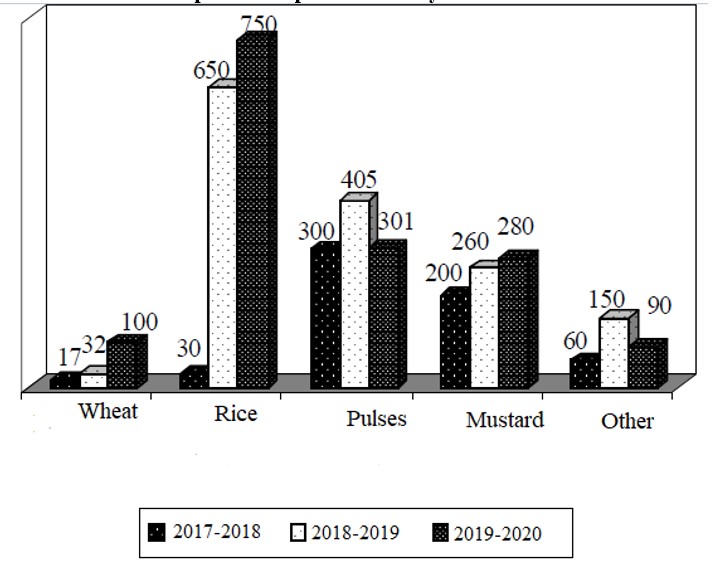
Crops exports in 2017-18
= Rs. (17+30+300+200+60)lacs
= Rs. 607 lacs
Crops export in 2019-20
= Rs. (100 + 750 + 301 + 280 + 90)
= Rs. 1521 lacs
% growth
New answer posted
11 months ago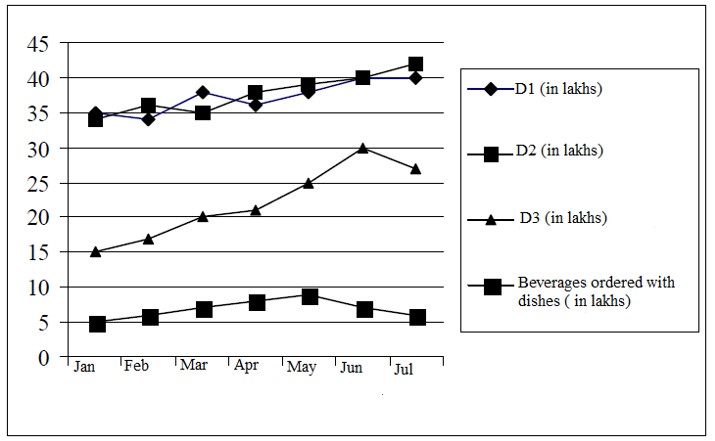
Contributor-Level 10
Profit made on June
= (320 * 0.093) + (160 * 0.37) = Rs. 88.96 lakhss
which is the highest.
Taking an Exam? Selecting a College?
Get authentic answers from experts, students and alumni that you won't find anywhere else
Sign Up on ShikshaOn Shiksha, get access to
- 66k Colleges
- 1.2k Exams
- 703k Reviews
- 1850k Answers