

Chemistry
Get insights from 6.9k questions on Chemistry, answered by students, alumni, and experts. You may also ask and answer any question you like about Chemistry
Follow Ask QuestionQuestions
Discussions
Active Users
Followers
New answer posted
11 months agoContributor-Level 10
Leaching involves the given reaction,
Here, O2 is required for formation of Au (l) cyanide complex but no complex in absence of O2.
In above displacement reaction, Zn is oxidized.
New answer posted
11 months agoContributor-Level 10
Structure PCl5 is trigonal bipyramidal,
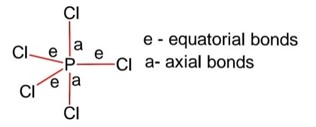
Hybridization of P is sp3d
Equatorial bonds lie in a plane
Axial bonds are longer than equatorial bonds so axial bonds are weaker than equatorial bonds.
New answer posted
11 months agoContributor-Level 10
Fluorine forms only one oxoacid which is hypofluorous acid HOF because it shows only – 1 oxidation state. Which is due to its the smallest size among halogens & the highest electronegativity.
New answer posted
11 months agoContributor-Level 10
Higher the E.N. difference between hydrogen and other atom then higher be the strength of intermolecular H-bond
Here, order of difference in E.N is
O - H > N – H > C - H
Hence, correct order of H bond strength is,
CH4 < HCN < NH3
New answer posted
11 months agoContributor-Level 10
Leaching involves the given reaction,
Here, O2 is required for formation of Au (l) cyanide complex but no complex in absence of O2.
In above displacement reaction, Zn is oxidized.
New question posted
11 months agoNew question posted
12 months agoTaking an Exam? Selecting a College?
Get authentic answers from experts, students and alumni that you won't find anywhere else
Sign Up on ShikshaOn Shiksha, get access to
- 66k Colleges
- 1.2k Exams
- 703k Reviews
- 1850k Answers