

English
Get insights from 1.8k questions on English, answered by students, alumni, and experts. You may also ask and answer any question you like about English
Follow Ask QuestionQuestions
Discussions
Active Users
Followers
New answer posted
a year ago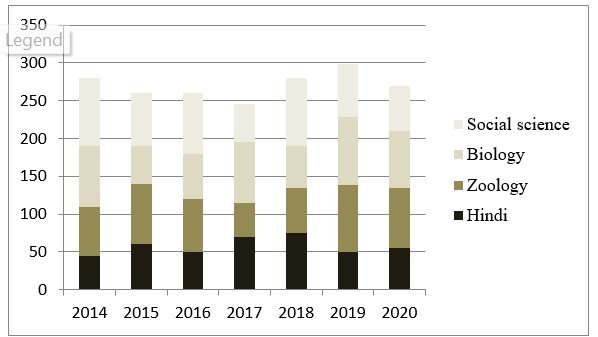
Contributor-Level 10
(c)
Average marks in 2014 = 280
Average marks in 2020 = 270
Percentage decrease = 3.7%
New answer posted
a year agoContributor-Level 10
(c)
Year | Total marks |
1994 | 280 |
1995 | 260 |
1996 | 260 |
1997 | 245 |
1998 | 280 |
1999 | 295 |
2000 | 270 |
New answer posted
a year agoContributor-Level 10
(a)
Percentage increase in average marks in social Science in 1996 over the previous year = 14.28%
Percentage increase on average marks in Biology in 1996 over the previous year = 20%
Difference = 20% - 14.28% = 5.72%
New answer posted
a year agoContributor-Level 10
(b)
Maximum increase in average marks is observed for Social Science from 2017 to 2018.
New answer posted
a year agoContributor-Level 10
One of the men spent 2517 – 1378 = 1139, he is Aman. This is the only possibility as we add Rs. 1378 even to the least amount Rs. 1193, we will not be able to satisfy all the conditions given simultaneously.
So, the table obtained is:
Raman | Aman | Dev | Sanjay | Kamal |
2234 | 1139 | 1139 | 1340 | 2517 |
(c)
New answer posted
a year agoContributor-Level 10
One of the men spent 2517 – 1378 = 1139, he is Aman. This is the only possibility as we add Rs. 1378 even to the least amount Rs. 1193, we will not be able to satisfy all the conditions given simultaneously.
So, the table obtained is:
Raman | Aman | Dev | Sanjay | Kamal |
2234 | 1139 | 1139 | 1340 | 2517 |
(c)
New answer posted
a year agoContributor-Level 10
One of the men spent 2517 – 1378 = 1139, he is Aman. This is the only possibility as we add Rs. 1378 even to the least amount Rs. 1193, we will not be able to satisfy all the conditions given simultaneously.
So, the table obtained is:
Raman | Aman | Dev | Sanjay | Kamal |
2234 | 1139 | 1139 | 1340 | 2517 |
(a)
New answer posted
a year agoContributor-Level 10
One of the men spent 2517 – 1378 = 1139, he is Aman. This is the only possibility as we add Rs. 1378 even to the least amount Rs. 1193, we will not be able to satisfy all the conditions given simultaneously.
So, the table obtained is:
Raman | Aman | Dev | Sanjay | Kamal |
2234 | 1139 | 1139 | 1340 | 2517 |
(b)
New answer posted
a year ago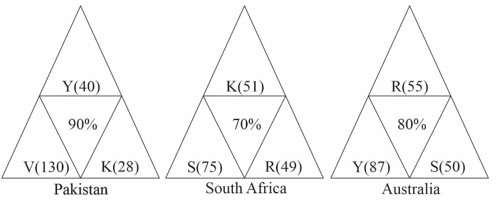
Contributor-Level 10
(b)
Y scored 127 in G1 and G3. V scored 130 in G1 itself.
K's mas score could be 28 + 51 + 48 = 127
R's mas score could be 49 + 55 + 22 = 126
S's mas score could be 75 + 50 + 22 = 147
Only R definitely scored less than Y.
Hence, option 2.
New answer posted
a year agoContributor-Level 10
(c)
Form answer to the first question, the M-index of only R and S can be exactly calculated.
Hence, option (c)
Taking an Exam? Selecting a College?
Get authentic answers from experts, students and alumni that you won't find anywhere else
Sign Up on ShikshaOn Shiksha, get access to
- 67k Colleges
- 1.2k Exams
- 719k Reviews
- 1850k Answers