

Maths
Get insights from 6.5k questions on Maths, answered by students, alumni, and experts. You may also ask and answer any question you like about Maths
Follow Ask QuestionQuestions
Discussions
Active Users
Followers
New answer posted
9 months agoContributor-Level 10
First plane, P1 = 2x – 2y + z = 0,
normal vector
Second plane, P2 = x – y + 2z = 4,
normal vector
Plane perpendicular to P1 and P2 will have normal vector n3 where n3 = (n1 * n2)
Hence,
n3 = (3, 0)
Distance PQ
New answer posted
9 months agoContributor-Level 10
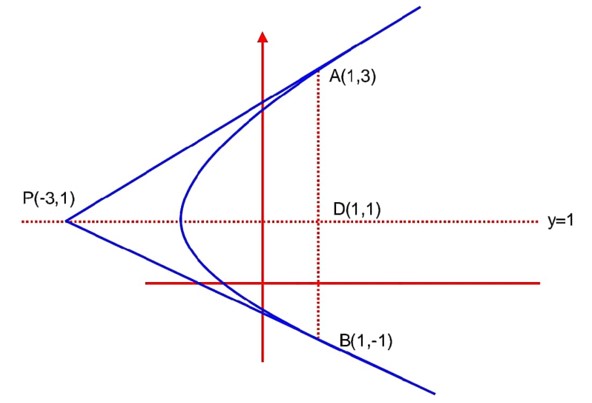
…. (i)
Equation of tangent at A is 2x – y – 5 = 0 ………. (ii)
D is mid point of AB solving (ii) with y = 1 P (3, 1)
New answer posted
9 months agoContributor-Level 10
(B)
(C)
(D)
Using Venn diagram we get B as the correct option.
New answer posted
9 months agoContributor-Level 10
Given :
Similarly,
=
Given : 14
Given : are coplanar & pair wise equal angle.
New answer posted
9 months agoContributor-Level 10
W = (2x, y) = (a, y)
Let S represent the line segment AB
For 'B'
x2 + y2 = 4
x = -y
-> x2 = 2
->
W (2x, y) lies on AB
->
New answer posted
9 months agoContributor-Level 10
I II
Let
E1 : a red ball is transferred from I to II
E2 : a black is transferred from I to II
E3 :a white transferred from I to II
E : a black ball is drawn from 2nd bag after a ball from I to II was transferred.
=
=
Taking an Exam? Selecting a College?
Get authentic answers from experts, students and alumni that you won't find anywhere else
Sign Up on ShikshaOn Shiksha, get access to
- 66k Colleges
- 1.2k Exams
- 691k Reviews
- 1850k Answers