

Data Interpretation
Get insights from 212 questions on Data Interpretation, answered by students, alumni, and experts. You may also ask and answer any question you like about Data Interpretation
Follow Ask QuestionQuestions
Discussions
Active Users
Followers
New answer posted
11 months agoContributor-Level 10
From statement (I), the table, we can observe that Myanmar has the highest annual growth
Statement (II), in interval 2019-20, Egyptn has second the highest growth rate, while Nigeria have the highest growth.
Statement (III), Nigeria register third the highest growth is wrong because it exhibits 28.2% which is the highest in 2017 to 2018.
Statement (IV),
Growth rate of 2016-2017
Growth rate of 2017-2018
Difference = 4.8 – (–5.9) = 10.7%
New answer posted
11 months agoContributor-Level 10
Average annual growth
Nigeria
UK
Egypt
Portugal
Portugal experienced third the highest growth.
New answer posted
11 months agoContributor-Level 10
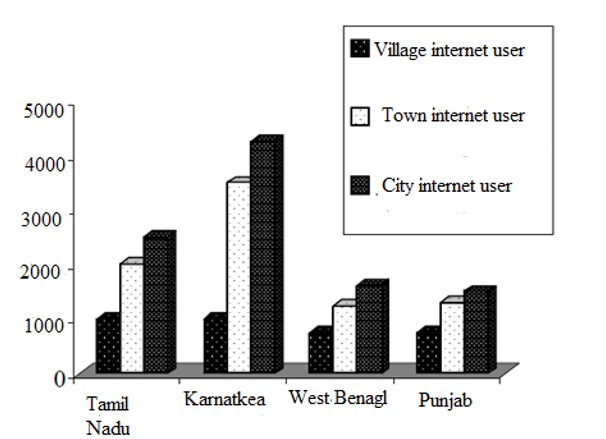
Total expenditure on internet by cities users = 7500 * 50000 = 375000000
Total expenditure on internet by town users = 5000 * 100000 = 50000000
= = 25%
New answer posted
11 months agoContributor-Level 10
The percentage increase in total number of households that uses internet in Tamil Nadu is 200%.
New answer posted
11 months agoContributor-Level 10
Statewise breakup is not available. Hence, question cannot be answered.
New answer posted
11 months ago
Contributor-Level 10
Earning of employee in finance =
= 9550750
Earning of employee working in software department =
Difference in the amount earned = 9550750 – 8720250 = 830500
New answer posted
11 months agoContributor-Level 10
To make a new alloy with atleast 60% Cobalt we can use option (b) or (d) only but the lowest cost per unit can be achieved when A2, A3 and A5 are mixed in the ratio 4 : 1 : 1.
Taking an Exam? Selecting a College?
Get authentic answers from experts, students and alumni that you won't find anywhere else
Sign Up on ShikshaOn Shiksha, get access to
- 66k Colleges
- 1.2k Exams
- 708k Reviews
- 1850k Answers