
Data Interpretation
Get insights from 221 questions on Data Interpretation, answered by students, alumni, and experts. You may also ask and answer any question you like about Data Interpretation
- 221
Questions
- 0
Discussions
- 9
Active Users
- 0
Followers
Have a question about Data Interpretation? Ask our experts
Keep it short & simple. Type complete word. Avoid abusive language.
Refer to the following data-set and solve the questions based on it. Data Pertains to Paras Ltd.
Sector
Factories
Employment
Fixed capital
Variable cost
Value Added
Government
18
15
14
22
12
Central
8
6
5
7
10
State
4
6
4
8
3
Central/State
6
3
5
7
12
Public
12
8
6
19
8
Private
55
65
72
54
62
Joint
15
12
8
5
5
Total
100
100
100
100
100
Which of the following sectors has the maximum fixed capital invested per factory?
Refer to the following data-set and solve the questions based on it. Data Pertains to Paras Ltd.
|
Sector |
Factories |
Employment |
Fixed capital |
Variable cost |
Value Added |
|
Government |
18 |
15 |
14 |
22 |
12 |
|
Central |
8 |
6 |
5 |
7 |
10 |
|
State |
4 |
6 |
4 |
8 |
3 |
|
Central/State |
6 |
3 |
5 |
7 |
12 |
|
Public |
12 |
8 |
6 |
19 |
8 |
|
Private |
55 |
65 |
72 |
54 |
62 |
|
Joint |
15 |
12 |
8 |
5 |
5 |
|
Total |
100 |
100 |
100 |
100 |
100 |
Which of the following sectors has the maximum fixed capital invested per factory?
Fixed capital per factory will be proportional to the following ratios:
Central | 5/8 |
State | 4/4 |
Central/state | 5/6 |
Public | 6/12 |
 Upvote

Directions for question: Refer to the following data-set and solve the questions based on it. Data Pertains to Paras Ltd.
Sector
Factories
Employment
Fixed capital
Variable cost
Value Added
Government
18
15
14
22
12
Central
8
6
5
7
10
State
4
6
4
8
3
Central/State
6
3
5
7
12
Public
12
8
6
19
8
Private
55
65
72
54
62
Joint
15
12
8
5
5
Total
100
100
100
100
100
If the total work force was 76 million, whereas the total values added were 225 million, then which of the following had the maximum value addition per worker?
Directions for question: Refer to the following data-set and solve the questions based on it. Data Pertains to Paras Ltd.
|
Sector |
Factories |
Employment |
Fixed capital |
Variable cost |
Value Added |
|
Government |
18 |
15 |
14 |
22 |
12 |
|
Central |
8 |
6 |
5 |
7 |
10 |
|
State |
4 |
6 |
4 |
8 |
3 |
|
Central/State |
6 |
3 |
5 |
7 |
12 |
|
Public |
12 |
8 |
6 |
19 |
8 |
|
Private |
55 |
65 |
72 |
54 |
62 |
|
Joint |
15 |
12 |
8 |
5 |
5 |
|
Total |
100 |
100 |
100 |
100 |
100 |
If the total work force was 76 million, whereas the total values added were 225 million, then which of the following had the maximum value addition per worker?
Values added per worker for various sector will be proportional to the following ratio:
Central | 10/6 |
State | 3/6 |
Central/state | 12/3 |
Public | 8/8 |
Upvote The figure below represents sales and net profit (in Rs. crore) of IVP Ltd., for five years from 2014-2015 to 2018-2019. During this period, the sales increased from Rs. 100 crore to Rs. 680 crore. Correspondingly, the net profit increased from Rs. 2.5 crore to Rs. 12 crore. (Net profit is defined as the excess of sales over total costs.)
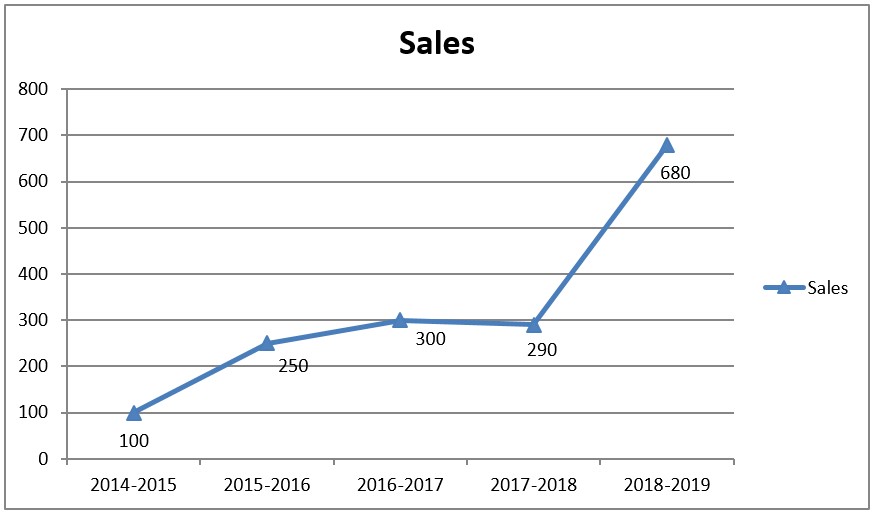
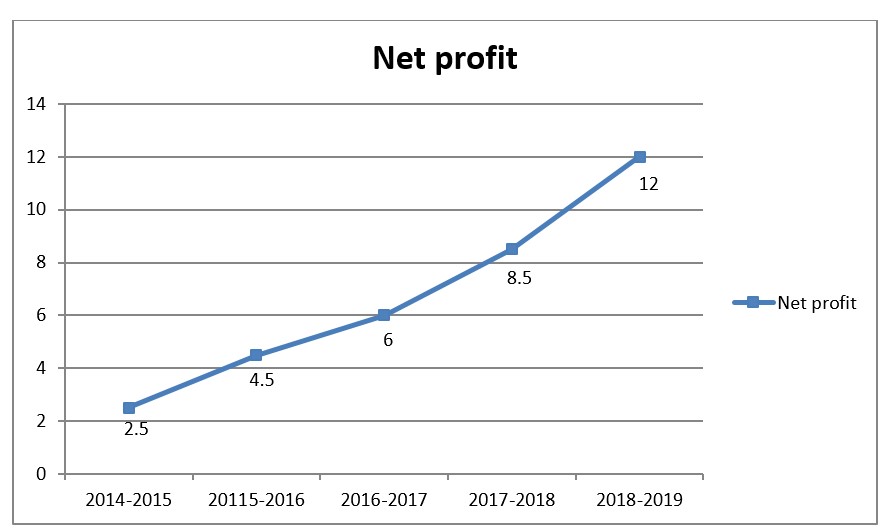
Defining profitability as the ratio of net profit to sales, IVP Ltd recorded the highest profitability in ______.
The figure below represents sales and net profit (in Rs. crore) of IVP Ltd., for five years from 2014-2015 to 2018-2019. During this period, the sales increased from Rs. 100 crore to Rs. 680 crore. Correspondingly, the net profit increased from Rs. 2.5 crore to Rs. 12 crore. (Net profit is defined as the excess of sales over total costs.)
Defining profitability as the ratio of net profit to sales, IVP Ltd recorded the highest profitability in ______.
| Net profit | Net sales | Ratio |
2014-15 | 2.5 | 100 | 0.025 |
2015-16 | 4.5 | 250 | 0.02 |
2016-17 | 6 | 300 | 0.02 |
2017-18 | 8.5 | 290 | 0.03 |
2018-19 | 12 | 680 | 0.018 |
Therefore, profitability is maximum for 1997-1998]
Upvote The figure below represents sales and net profit (in Rs. crore) of IVP Ltd., for five years from 2014-2015 to 2018-2019. During this period, the sales increased from Rs. 100 crore to Rs. 680 crore. Correspondingly, the net profit increased from Rs. 2.5 crore to Rs. 12 crore. (Net profit is defined as the excess of sales over total costs.)
The highest percentage growth in profit, relative to the previous year, was achieved in ______.
The figure below represents sales and net profit (in Rs. crore) of IVP Ltd., for five years from 2014-2015 to 2018-2019. During this period, the sales increased from Rs. 100 crore to Rs. 680 crore. Correspondingly, the net profit increased from Rs. 2.5 crore to Rs. 12 crore. (Net profit is defined as the excess of sales over total costs.)
The highest percentage growth in profit, relative to the previous year, was achieved in ______.
We can again calculate the growth in profits.
| Previous Profit | Current Profit | Difference | Percentage |
2015-16 | 2.5 | 4.5 | 2 | 80% |
2016-17 | 4.5 | 6 | 1.5 | 33.33% |
2017-18 | 6.0 | 8.5 | 2.5 | 41.66% |
2018-19 | 8.5 | 12 | 3.5 | 41.2% |
The highest percentage growth in net profit relative to the previous year was achieved in 2015-2016.
Upvote Directions for question: Refer to the following chart and solve the questions based on it.
The figure below represents sales and net profit (in Rs. crore) of IVP Ltd., for five years from 2014-2015 to 2018-2019. During this period, the sales increased from Rs. 100 crore to Rs. 680 crore. Correspondingly, the net profit increased from Rs. 2.5 crore to Rs. 12 crore. (Net profit is defined as the excess of sales over total costs.)
The highest percentage growth in sales, relative to the previous year occurred in ______.
Directions for question: Refer to the following chart and solve the questions based on it.
The figure below represents sales and net profit (in Rs. crore) of IVP Ltd., for five years from 2014-2015 to 2018-2019. During this period, the sales increased from Rs. 100 crore to Rs. 680 crore. Correspondingly, the net profit increased from Rs. 2.5 crore to Rs. 12 crore. (Net profit is defined as the excess of sales over total costs.)
The highest percentage growth in sales, relative to the previous year occurred in ______.
Using the graph, the percentage growth in sales are:
| Previous Profit | Current Profit | Difference | Percentage |
2015-16 | 100 | 250 | 150 | 150% |
2016-17 | 250 | 300 | 50 | 20% |
2017-18 | 300 | 290 | –10 | –3.33% |
2018-19 | 290 | 680 | 390 | 134.5% |
Upvote In a management course, student of 2nd year are asked to select four optional subjects from the given list of seven optional subjects. There are ten students whose roll numbers are from 1 to 10. They have selected four optional subjects each. Their subjects selected are indicated by “?” marks.
Courses
Roll number
1
2
3
4
5
6
7
8
9
10
MA
?
?
?
?
?
?
?
MSc
?
?
?
?
?
B.Com
?
?
?
?
?
M.Com
?
?
?
?
?
?
B.Sc
?
?
?
?
BBA
?
?
?
?
?
?
MBA
?
?
?
?
?
?
?
Which optional subject was chosen by maximum number of students?
In a management course, student of 2nd year are asked to select four optional subjects from the given list of seven optional subjects. There are ten students whose roll numbers are from 1 to 10. They have selected four optional subjects each. Their subjects selected are indicated by “?” marks.
|
Courses |
Roll number |
|||||||||
|
|
1 |
2 |
3 |
4 |
5 |
6 |
7 |
8 |
9 |
10 |
|
MA |
? |
|
? |
? |
|
? |
|
? |
? |
? |
|
MSc |
|
? |
? |
|
? |
? |
|
? |
|
|
|
B.Com |
|
|
? |
|
|
? |
? |
|
? |
? |
|
M.Com |
? |
? |
|
? |
? |
|
? |
? |
|
|
|
B.Sc |
|
? |
|
|
|
|
? |
|
? |
? |
|
BBA |
? |
|
? |
? |
? |
|
? |
? |
|
|
|
MBA |
? |
? |
|
? |
? |
? |
|
|
? |
? |
Which optional subject was chosen by maximum number of students?
MA → 7 students
B.Sc → 4 students
MBCA → 5 students
M.Com → 6 student
Upvote In a management course, student of 2nd year are asked to select four optional subjects from the given list of seven optional subjects. There are ten students whose roll numbers are from 1 to 10. They have selected four optional subjects each. Their subjects selected are indicated by “?” marks.
Courses
Roll number
1
2
3
4
5
6
7
8
9
10
MA
?
?
?
?
?
?
?
MSc
?
?
?
?
?
B.Com
?
?
?
?
?
M.Com
?
?
?
?
?
?
B.Sc
?
?
?
?
BBA
?
?
?
?
?
?
MBA
?
?
?
?
?
?
?
Which roll numbers have the maximum common number of optional subjects?
In a management course, student of 2nd year are asked to select four optional subjects from the given list of seven optional subjects. There are ten students whose roll numbers are from 1 to 10. They have selected four optional subjects each. Their subjects selected are indicated by “?” marks.
|
Courses |
Roll number |
|||||||||
|
|
1 |
2 |
3 |
4 |
5 |
6 |
7 |
8 |
9 |
10 |
|
MA |
? |
|
? |
? |
|
? |
|
? |
? |
? |
|
MSc |
|
? |
? |
|
? |
? |
|
? |
|
|
|
B.Com |
|
|
? |
|
|
? |
? |
|
? |
? |
|
M.Com |
? |
? |
|
? |
? |
|
? |
? |
|
|
|
B.Sc |
|
? |
|
|
|
|
? |
|
? |
? |
|
BBA |
? |
|
? |
? |
? |
|
? |
? |
|
|
|
MBA |
? |
? |
|
? |
? |
? |
|
|
? |
? |
Which roll numbers have the maximum common number of optional subjects?
(1) Roll number 1 and 8 have MA, M.Com and BBA as common.
(2) Roll number 3 and 6 have MA, MSC, B.Com as common.
(3) Roll number 9 and 10 have all the four common options.
(4) Roll number 2 and 5 have MSC, M.Com and MBA as common.
Upvote Direction for question: Go through the data set given below and solve the question based on it.
In a management course, student of 2nd year are asked to select four optional subjects from the given list of seven optional subjects. There are ten students whose roll numbers are from 1 to 10. They have selected four optional subjects each. Their subjects selected are indicated by “?” marks.
Courses
Roll number
1
2
3
4
5
6
7
8
9
10
MA
?
?
?
?
?
?
?
MSc
?
?
?
?
?
B.Com
?
?
?
?
?
M.Com
?
?
?
?
?
?
B.Sc
?
?
?
?
BBA
?
?
?
?
?
?
MBA
?
?
?
?
?
?
?
Which of the following triple courses have maximum number of students in common?
Direction for question: Go through the data set given below and solve the question based on it.
In a management course, student of 2nd year are asked to select four optional subjects from the given list of seven optional subjects. There are ten students whose roll numbers are from 1 to 10. They have selected four optional subjects each. Their subjects selected are indicated by “?” marks.
|
Courses |
Roll number |
|||||||||
|
|
1 |
2 |
3 |
4 |
5 |
6 |
7 |
8 |
9 |
10 |
|
MA |
? |
|
? |
? |
|
? |
|
? |
? |
? |
|
MSc |
|
? |
? |
|
? |
? |
|
? |
|
|
|
B.Com |
|
|
? |
|
|
? |
? |
|
? |
? |
|
M.Com |
? |
? |
|
? |
? |
|
? |
? |
|
|
|
B.Sc |
|
? |
|
|
|
|
? |
|
? |
? |
|
BBA |
? |
|
? |
? |
? |
|
? |
? |
|
|
|
MBA |
? |
? |
|
? |
? |
? |
|
|
? |
? |
Which of the following triple courses have maximum number of students in common?
(1) Roll number 3 and 6
(2) Roll number 1, 4 and 8
(3) Roll number 9, 10
(4) Roll number 7
Upvote
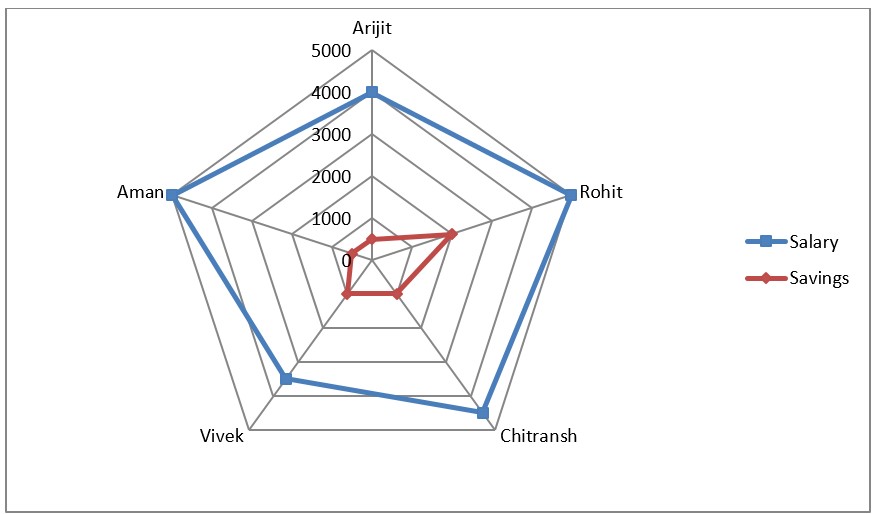
The above given radar diagram gives the salary and savings of five persons Arijit, Rohit, Chitransh, Vivek and Aman for the month of October 2023. All the values are in the multiples of Rs. 500
Salary – Savings = Expenditure
For how many of the given persons, the savings is more than 20% of the salary for the given period?
The above given radar diagram gives the salary and savings of five persons Arijit, Rohit, Chitransh, Vivek and Aman for the month of October 2023. All the values are in the multiples of Rs. 500
Salary – Savings = Expenditure
For how many of the given persons, the savings is more than 20% of the salary for the given period?
The above given radar diagram gives the salary and savings of five persons Arijit, Rohit, Chitransh, Vivek and Aman for the month of October 2023. All the values are in the multiples of Rs. 500
Salary – Savings = Expenditure
For who among the following expenditure expressed as a percentage of salary for the given period the maximum?
The above given radar diagram gives the salary and savings of five persons Arijit, Rohit, Chitransh, Vivek and Aman for the month of October 2023. All the values are in the multiples of Rs. 500
Salary – Savings = Expenditure
For who among the following expenditure expressed as a percentage of salary for the given period the maximum?