

Data Interpretation
Get insights from 212 questions on Data Interpretation, answered by students, alumni, and experts. You may also ask and answer any question you like about Data Interpretation
Follow Ask QuestionQuestions
Discussions
Active Users
Followers
New answer posted
11 months ago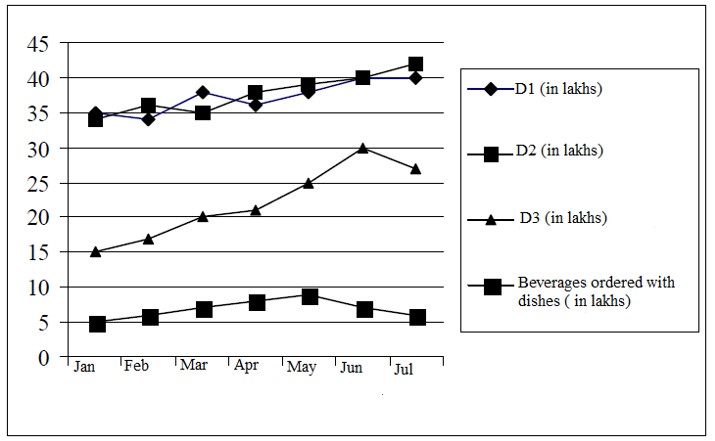
Contributor-Level 10
Profit made on June
= (320 * 0.093) + (160 * 0.37) = Rs. 88.96 lakhss
which is the highest.
New answer posted
11 months agoContributor-Level 10
The difference between the sum of D1 and D2 dishes is maximum in the month of July. So, with respect to the sum of D1 and D2 dishes least beverages order in month of July.
New answer posted
11 months agoContributor-Level 10
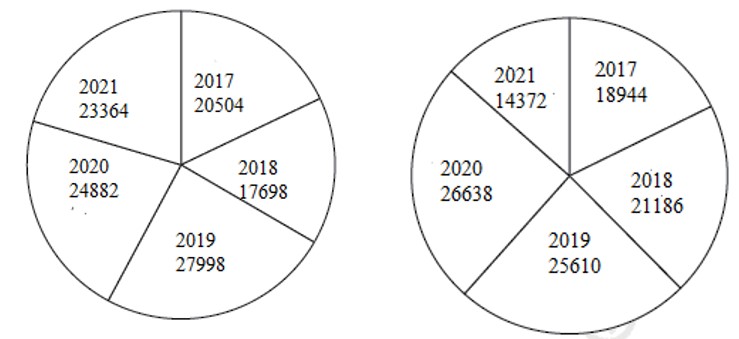
Growth in production of Gaya in 2019 = 27998 – 17698 = 10300
% growth
New answer posted
11 months agoContributor-Level 10
It's valid voter's declined steeply in contrast to its growing trend over the period.
New answer posted
11 months ago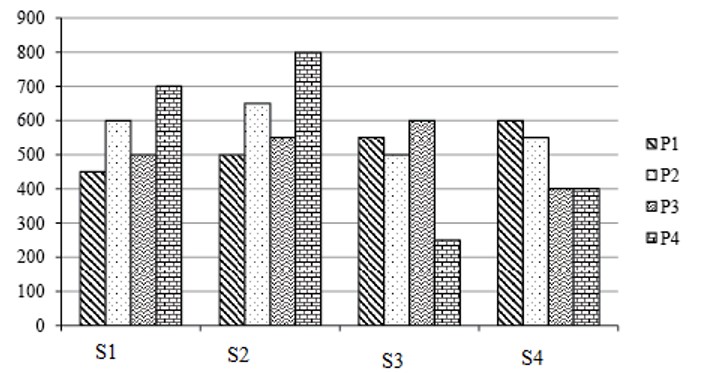
Contributor-Level 10
In both the cases Voltas's the lowest individual sales will be in Rohini electronics. Hence statement (I) is definitely true. Samsung's the highest individual sales will be in Ghada electronics in both the cases; hence statement (II) is definitely true as well
New answer posted
11 months agoContributor-Level 10
According to statement (I), Whirlpool will be P1 and Vijay electronics will be S4, which makes Gajraj electronics as S1 and LG as P3, making statement 2 true. Thus if one of them is false the other will automatically become true.
New answer posted
11 months agoContributor-Level 10
| P1 | P2 | P3 | P4 | Phase total of 4 brands |
S1 | 450 | 600 | 500 | 700 | 2250 |
S2 | 500 | 650 | 550 | 800 | 2500 |
S3 | 550 | 500 | 600 | 250 | 1900 |
S4 | 600 | 550 | 400 | 400 | 1950 |
Total runs score by the player | 2100 | 2300 | 2050 | 2150 |
|
Using additional information,
| LG/Whirlpool | Samsung/ Voltas | LG/Whirlpool | Samsung/ Voltas | Phase total |
S1 | 450 | 600 | 500 | 700 | 2250 |
S2 | 500 | 650 | 550 | 800 | 2500 |
S3 | 550 | 500 | 600 | 250 | 1900 |
S4 | 600 | 550 | 400 | 400 | 1950 |
Player total | 2100 | 2300 | 2050 | 2150 |
|
From table, LG's second highest sales can be either in knock outs or Ghada electronics, hence statement (I) is definitely false.
Highest individual sales in Ghada electronics is 800. Now Gajraj electronics can have a sales of either 700 or 400, hence there is possibility of difference of 100, so statement (II) could be true.
Taking an Exam? Selecting a College?
Get authentic answers from experts, students and alumni that you won't find anywhere else
Sign Up on ShikshaOn Shiksha, get access to
- 66k Colleges
- 1.2k Exams
- 708k Reviews
- 1850k Answers