

Data Interpretation
Get insights from 218 questions on Data Interpretation, answered by students, alumni, and experts. You may also ask and answer any question you like about Data Interpretation
Follow Ask QuestionQuestions
Discussions
Active Users
Followers
New answer posted
a year agoContributor-Level 10
Only Virat got out in all the innings played. Take the help of the solution to Q1
New answer posted
a year agoContributor-Level 10
Rohit – 1800840 = 45
Hence, not-out in 3 innings
Gill – 2034/45.2 = 45
Hence, not out in 0 inings
Virat – 1679/36.5= 46
Hence, not–out in 0 innings
Rahul – 1445/42.5 = 34
Hence, not-out in 6 innings
Therefore, option (d) is the correct answer
New answer posted
a year agoContributor-Level 10
| Physics | Chemistry | Maths | English | Total |
A | 80 | 70 | 60 | 80 | 290 |
B | 60 | 60 | 60 | 60 | 240 |
C | 40 | 50 | 60 | 70 | 220 |
D | 90 | 80 | 60 | 60 | 290 |
New answer posted
a year agoContributor-Level 10
Neither of the statements (a) or (b) can be inferred, as we know only the percentages and not the actual values of the employee, factories or fixed capital.
New answer posted
a year agoContributor-Level 10
Fixed capital per factory will be proportional to the following ratios:
Central | 5/8 |
State | 4/4 |
Central/state | 5/6 |
Public | 6/12 |
New answer posted
a year agoContributor-Level 10
Values added per worker for various sector will be proportional to the following ratio:
Central | 10/6 |
State | 3/6 |
Central/state | 12/3 |
Public | 8/8 |
New answer posted
a year ago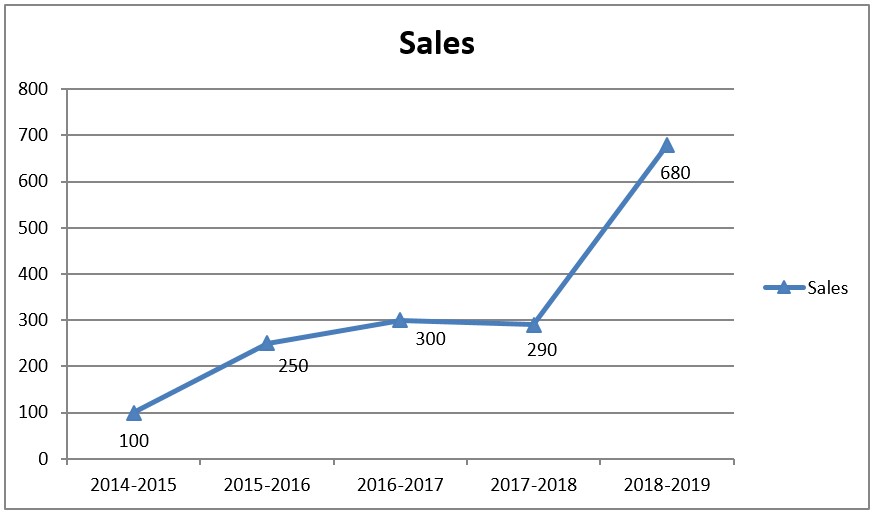
Contributor-Level 10
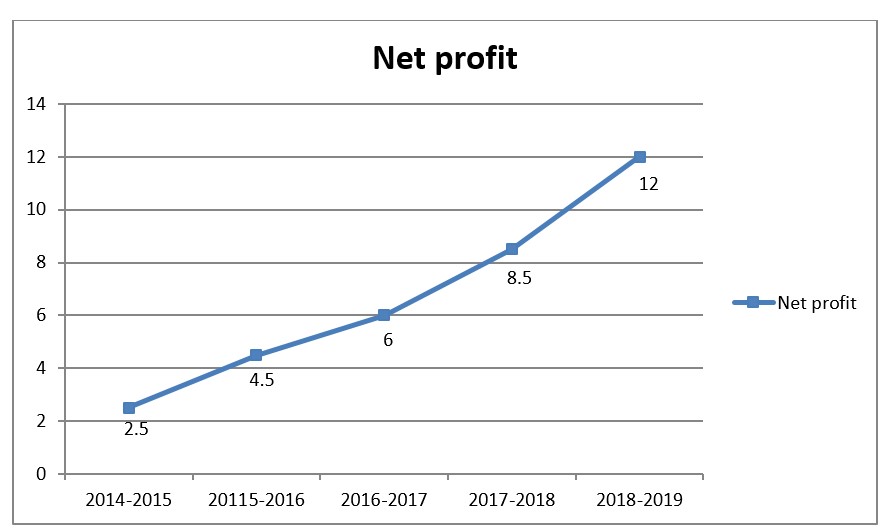
| Net profit | Net sales | Ratio |
2014-15 | 2.5 | 100 | 0.025 |
2015-16 | 4.5 | 250 | 0.02 |
2016-17 | 6 | 300 | 0.02 |
2017-18 | 8.5 | 290 | 0.03 |
2018-19 | 12 | 680 | 0.018 |
Therefore, profitability is maximum for 1997-1998]
Taking an Exam? Selecting a College?
Get authentic answers from experts, students and alumni that you won't find anywhere else
Sign Up on ShikshaOn Shiksha, get access to
- 67k Colleges
- 1.2k Exams
- 716k Reviews
- 1850k Answers