

Ncert Solutions Maths class 11th
Get insights from 1.6k questions on Ncert Solutions Maths class 11th, answered by students, alumni, and experts. You may also ask and answer any question you like about Ncert Solutions Maths class 11th
Follow Ask QuestionQuestions
Discussions
Active Users
Followers
New answer posted
11 months agoContributor-Level 10
60. Given, f (x) =
So, f?(x) =
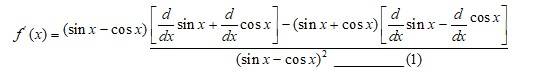
Let g(x) = cos x and p(x) = sin x.
{from so g'(x) A ) (upto equation 3)
Let g(x) = cos2 and p(x) = sin x.
So, g?(x) =
= -sin x ______ (2)
And p?(x) =
= cos x _____ (3)
Putting (2) and (3) in (1) we get,
New answer posted
11 months agoContributor-Level 10
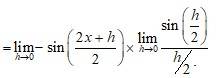
59. Given, f (x) =
So, f?(x) =

Putting (2) and (3) in (1) we get,
New answer posted
11 months agoContributor-Level 10
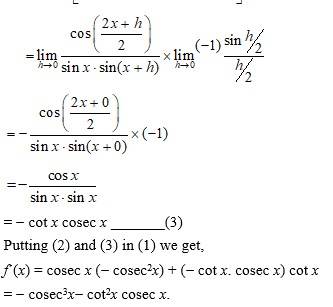
58. Given f (x) = cosec x. cot x.
By Leibnitz product rule,
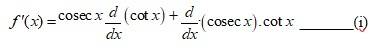
So, g(x) =
= -cosec2x.______(2)
And hx) =
New answer posted
11 months agoContributor-Level 10
55. Given, f (x) = (ax + b)n
Chain rule, where
u (x) is a function of x.
So, f (x) =

Taking an Exam? Selecting a College?
Get authentic answers from experts, students and alumni that you won't find anywhere else
Sign Up on ShikshaOn Shiksha, get access to
- 66k Colleges
- 1.2k Exams
- 689k Reviews
- 1850k Answers