
Statistics
Get insights from 161 questions on Statistics, answered by students, alumni, and experts. You may also ask and answer any question you like about Statistics
- 161
Questions
- 0
Discussions
- 16
Active Users
- 0
Followers
Have a question about Statistics? Ask our experts
Keep it short & simple. Type complete word. Avoid abusive language.
17. The given data can be tabulated as follow
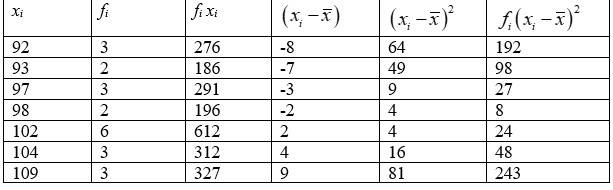
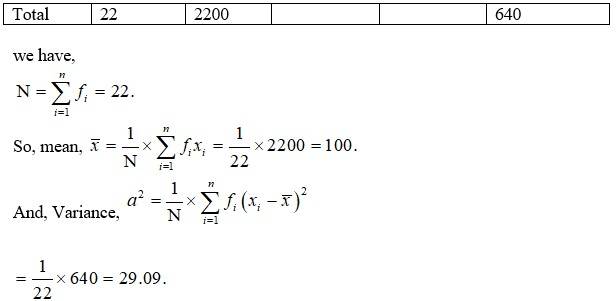
 Upvote

16. The given data can be tabulated as follow.
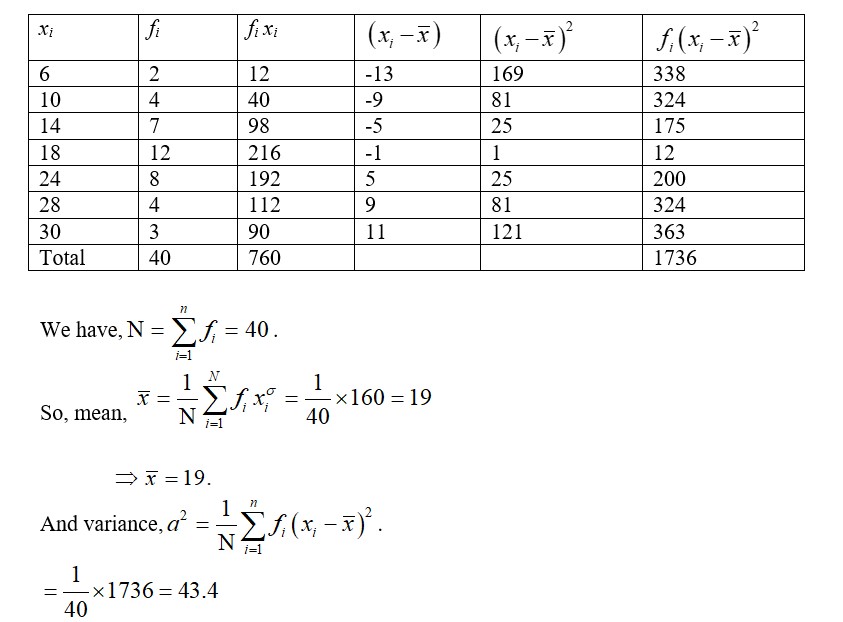
Upvote 15. We have, first 10 multiples of 3=3,6,9,12,15,18,21,24,27,30.
So,
We can now tabulate the given data as following.
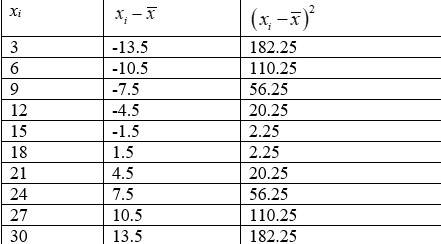

Therefore, variance,
= 74.25.
Upvote 14. We know that,
Sum of first'n ' natural no
So, mean,
So, Variance,
So,

And
Putting (2), (3) and (4) in (1) we get,
Upvote Class 11 Maths Statistics exercise 13.2 Solution
13. Find the mean and variance for each of the data in Exercies 13 to 17.
6, 7, 10, 12, 13, 4, 8, 12
Class 11 Maths Statistics exercise 13.2 Solution
13. Find the mean and variance for each of the data in Exercies 13 to 17.
6, 7, 10, 12, 13, 4, 8, 12
13. The given data can be tabulated as.

we have,
mean,
So, variance,
Upvote 12.Calculate the mean deviation about median age for the age distribution of 100 persons given below:
Age
(in years)
16-20
21-25
26-30
31-35
36-40
41-45
46-50
51-55
Number
5
6
12
14
26
12
16
9
[Hint Convert the given data into continuous frequency distribution by subtracting 0.5 from the lower limit and adding 0.5 to the upper limit of each class interval]
12.Calculate the mean deviation about median age for the age distribution of 100 persons given below:
|
Age (in years) |
16-20 |
21-25 |
26-30 |
31-35 |
36-40 |
41-45 |
46-50 |
51-55 |
|
Number |
5 |
6 |
12 |
14 |
26 |
12 |
16 |
9 |
[Hint Convert the given data into continuous frequency distribution by subtracting 0.5 from the lower limit and adding 0.5 to the upper limit of each class interval]
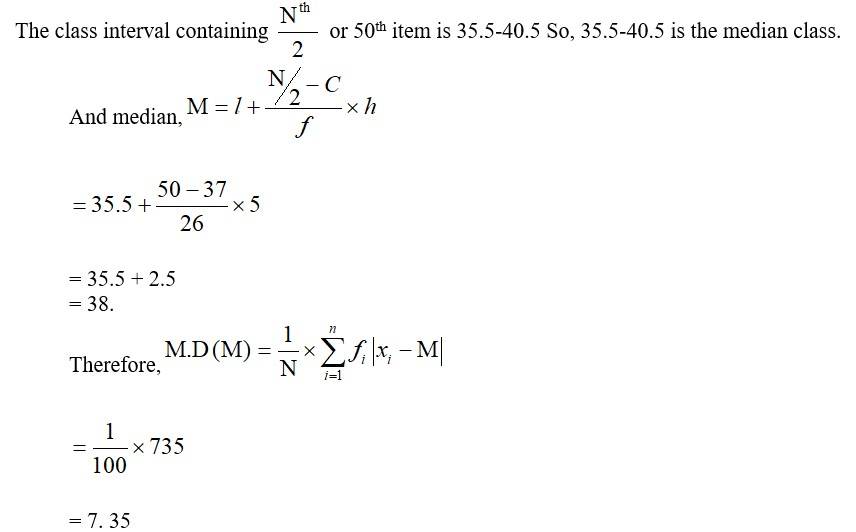
12. The given data is made'continuous by subtracting 0.5 from the lower limit and adding 0.5 to the upper limit of each class. So, we cam tabulate as.
Age | number fi | c.f. | mid-point xi | |xi - M| | fi |xi - M| |
15.5-20.5 | 5 | 5 | 18 | 20 | 100 |
20.5-25.5 | 6 | 11 | 23 | 15 | 90 |
25.5-30.5 | 12 | 23 | 28 | 10 | 120 |
30.5-35.5 | 14 | 37 | 33 | 5 | 70 |
35.5-40.5 | 26 | 63 | 38 | 0 | 0 |
40.5-45.5 | 12 | 75 | 43 | 5 | 60 |
45.5-50.5 | 16 | 91 | 48 | 10 | 160 |
50.5-55.5 | 9 | 100 | 53 | 15 | 135 |
Total | 100 |
|
|
| 735 |
Upvote 11.Find the mean deviation about median for the following data :
Marks
0-10
10-20
20-30
30-40
40-50
50-60
Number of girls
6
8
14
16
4
2
11.Find the mean deviation about median for the following data :
|
Marks |
0-10 |
10-20 |
20-30 |
30-40 |
40-50 |
50-60 |
|
Number of girls |
6 |
8 |
14 |
16 |
4 |
2 |
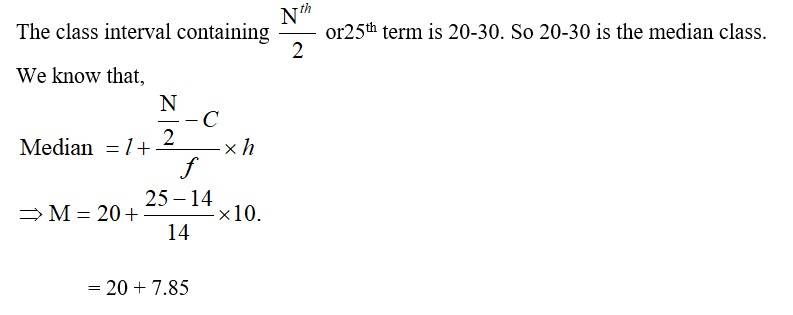
11. From the given data we can tabulate the following.
Marks | No. of girls (fi) | c.f. | mid-pointsxi | |xi - M| | fi |xi - M| |
0-10 | 6 | 6 | 5 | 22.85 | 137.1 |
10-20 | 8 | 14 | 15 | 12.85 | 102.8 |
20-30 | 14 | 28 | 35 | 2.85 | 39.9 |
30-40 | 16 | 44 | 35 | 7.15 | 114.4 |
40-50 | 4 | 48 | 45 | 17.15 | 68.6 |
50-60 | 2 | 50 | 55 | 27.15 | 54.3 |
Total | 50 |
|
|
| 517.1 |

Upvote 10.
Height in cms
95-105
105-115
115-125
125-135
135-145
145-155
Number of persons
9
13
26
30
12
10
10.
|
Height in cms |
95-105 |
105-115 |
115-125 |
125-135 |
135-145 |
145-155 |
|
Number of persons |
9 |
13 |
26 |
30 |
12 |
10 |
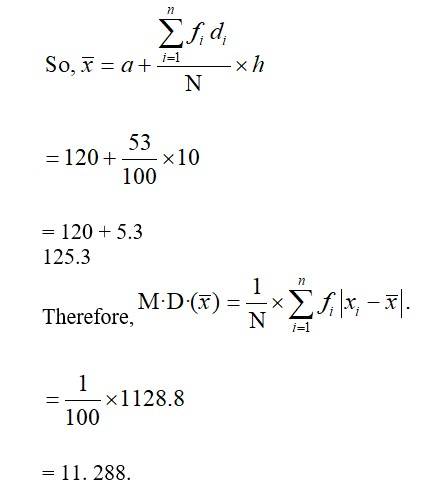
10. From the given data we can insulate the following.
Take the assumed mean a=120 and h=10
Heigts in cm. | No. of boys fi | Mid-pointsxi |  | fidi | |xi - x? | | fi |xi - x? | |
95-105 | 9 | 100 | -2 | -18 | 25.3 | 227.7 |
105-115 | 13 | 110 | -1 | -13 | 15.3 | 198.9 |
115-125 | 26 | 120 | 0 | 5.3 | 137.8 | |
125-135 | 30 | 130 | 1 | 30 | 4.7 | 141 |
135-145 | 12 | 140 | 2 | 24 | 14.7 | 176.4 |
145-155 | 10 | 150 | 3 | 30 | 24.7 | 247 |
Total | 100 |
| 53 |
| 1128.8 |
Upvote 9. Find the mean deviation about the mean for the data in Exercises 9 and 10.
Income per day`
0-100
100-200
200-300
300-400
400-500
500-600
600-700
700-800
Number of persons
4
8
9
10
7
5
4
3
9. Find the mean deviation about the mean for the data in Exercises 9 and 10.
|
Income per day` |
0-100 |
100-200 |
200-300 |
300-400 |
400-500 |
500-600 |
600-700 |
700-800 |
|
Number of persons |
4 |
8 |
9 |
10 |
7 |
5 |
4 |
3 |
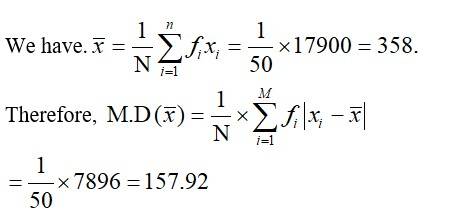
9. From the given data we cantabulate the following.
Income per day in ' | Number of person fi | Mid points xi | fi xi | |xi - x? | | fi |xi - x? | |
01-00 | 4 | 50 | 200 | 308 | 1232 |
100-200 | 8 | 150 | 1200 | 208 | 1664 |
200-300 | 9 | 250 | 2250 | 108 | 972 |
300-400 | 10 | 350 | 3500 | 8 | 80 |
400-500 | 7 | 450 | 3150 | 92 | 644 |
500-600 | 5 | 550 | 2750 | 192 | 960 |
600-700 | 4 | 650 | 2600 | 292 | 1168 |
700-800 | 3 | 750 | 2250 | 392 | 1176 |
Total | 50 |
| 17900 |
| 7896 |
Upvote 8. From the given data we can tabulate the following.
xi | fi | c.f. | |xi - M| | fi |xi - M| |
15 | 3 | 3 | 15 | 45 |
21 | 5 | 8 | 9 | 45 |
27 | 6 | 14 | 3 | 18 |
30 | 7 | 21 | 0 | 0 |
35 | 8 | 29 | 5 | 40 |
Total | 29 |
|
| 148 |
Here N = 29 which is odd.

= 5. 10
Upvote