
Statistics
Get insights from 161 questions on Statistics, answered by students, alumni, and experts. You may also ask and answer any question you like about Statistics
- 161
Questions
- 0
Discussions
- 16
Active Users
- 0
Followers
Have a question about Statistics? Ask our experts
Keep it short & simple. Type complete word. Avoid abusive language.
25. An analysis of monthly wages paid to workers in two firms A and B, belonging to the same industry, gives the following results:
Firm A Firm B
No. of wage earners 586 648
Mean of monthly wages ? 5253 ?5253
Variance of the distribution 100 121
of wages
(i) Which firm A or B pays larger amount as monthly wages?
(ii) Which firm, A or B, shows greater variability in individual wages?
25. An analysis of monthly wages paid to workers in two firms A and B, belonging to the same industry, gives the following results:
Firm A Firm B
No. of wage earners 586 648
Mean of monthly wages ? 5253 ?5253
Variance of the distribution 100 121
of wages
(i) Which firm A or B pays larger amount as monthly wages?
(ii) Which firm, A or B, shows greater variability in individual wages?
(i) The number of wage earner in firm A, nA=586. Mean monthly wages of firm

Total no of were canner in firm B.
Total monthly mages in firm. B = ?5253 × nB
=? 5253 × 586
=? 34, 03, 944
Firm B pays larger amount of monthly wages.
(ii) Since both the firm A and B has same mean monthly wages the firm wi
 Upvote

24. From the prices of shares X and Y below, find out which is more stable in value:
X
35
54
52
53
56
58
52
50
51
49
Y
108
107
105
105
106
107
104
103
104
101
24. From the prices of shares X and Y below, find out which is more stable in value:
|
X |
35 |
54 |
52 |
53 |
56 |
58 |
52 |
50 |
51 |
49 |
|
Y |
108 |
107 |
105 |
105 |
106 |
107 |
104 |
103 |
104 |
101 |
24. We can tabulate the given data as follows.
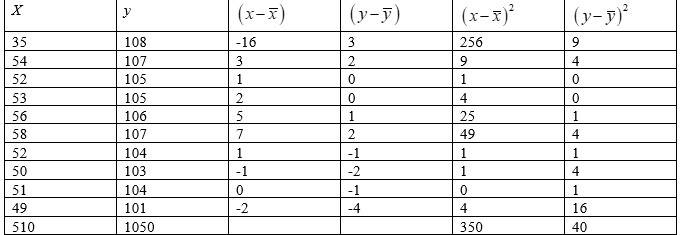
Total =
Mean of
Mean of .
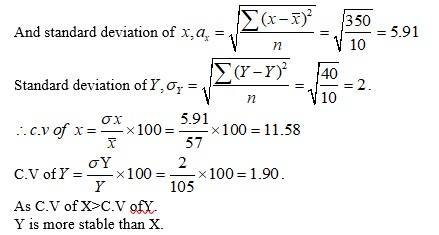
Upvote Class 11 Maths Statistics exercise 13.3 Solution
23. From the data given below state which group is more variable, A or B?
Marks
10-20
20-30
30-40
40-50
50-60
60-70
70-80
Group A
9
17
32
33
40
10
9
Group B
10
20
30
25
43
15
7
Class 11 Maths Statistics exercise 13.3 Solution
23. From the data given below state which group is more variable, A or B?
|
Marks |
10-20 |
20-30 |
30-40 |
40-50 |
50-60 |
60-70 |
70-80 |
|
Group A |
9 |
17 |
32 |
33 |
40 |
10 |
9 |
|
Group B |
10 |
20 |
30 |
25 |
43 |
15 |
7 |
23. Let the assumed mean be A=45 and h=10. Then we can tabulate the given data as following.
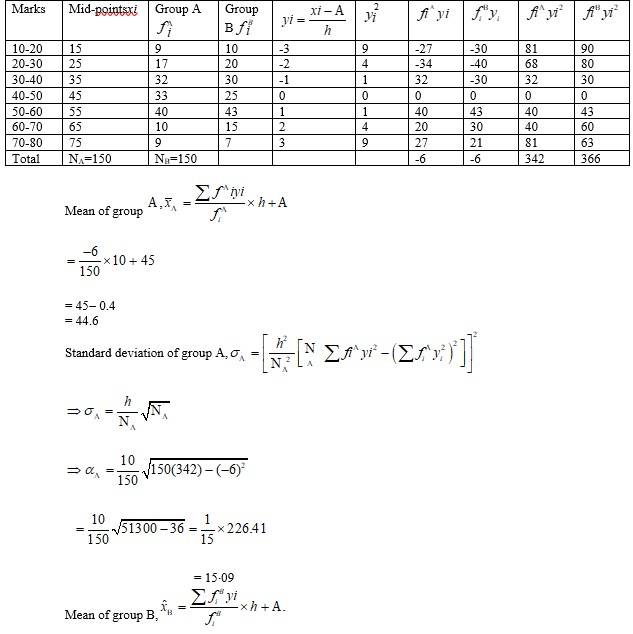
= 44.6
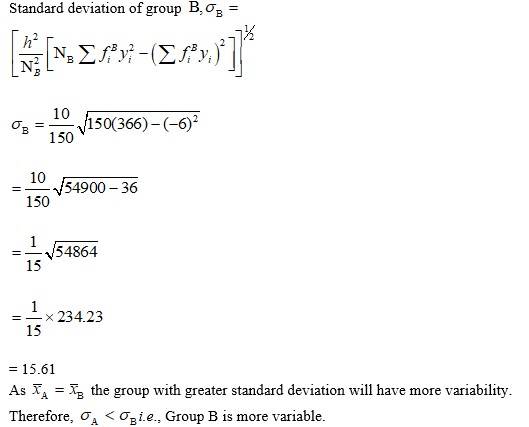
Upvote 22. The diameters of circles (in mm) drawn in a design are given below:
Diameters
33-36
37-40
41-44
45-48
49-52
No. of circles
15
17
21
22
25
Calculate the standard deviation and mean diameter of the circles.
[ Hint First make the data continuous by making the classes as 32.5-36.5, 36.5-40.5, 40.5-44.5, 44.5 - 48.5, 48.5 - 52.5 and then proceed.]
22. The diameters of circles (in mm) drawn in a design are given below:
|
Diameters |
33-36 |
37-40 |
41-44 |
45-48 |
49-52 |
|
No. of circles |
15 |
17 |
21 |
22 |
25 |
Calculate the standard deviation and mean diameter of the circles.
[ Hint First make the data continuous by making the classes as 32.5-36.5, 36.5-40.5, 40.5-44.5, 44.5 - 48.5, 48.5 - 52.5 and then proceed.]
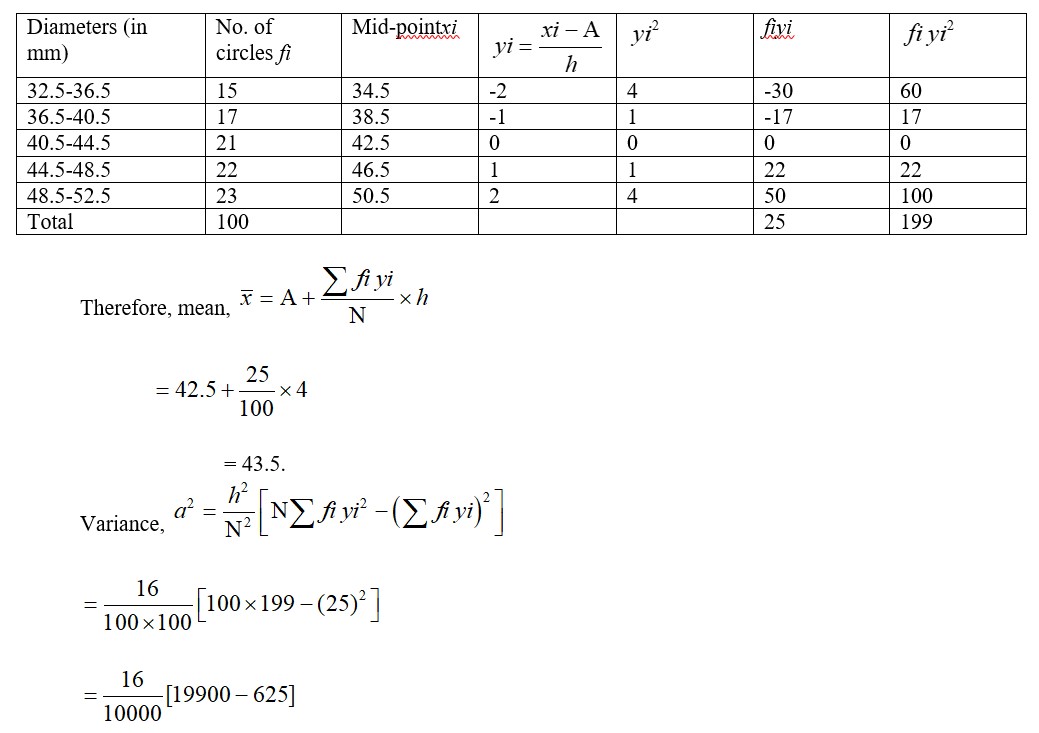
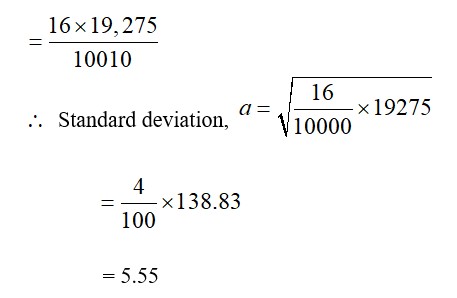
22. The given data is converted into continuous frequency duration by subtracting and adding 0.5 from lower and upper limit respectively. Lit the assumed mean be A=42.5 and h=4
 Upvote
21. Find the mean, variance and standard deviation using short-cut method
Height in cms
70-75
75-80
80-85
85-90
90-95
95-100
100-125
105-110
110-115
Frequencies
3
4
7
7
15
9
6
6
3
21. Find the mean, variance and standard deviation using short-cut method
|
Height in cms |
70-75 |
75-80 |
80-85 |
85-90 |
90-95 |
95-100 |
100-125 |
105-110 |
110-115 |
|
Frequencies |
3 |
4 |
7 |
7 |
15 |
9 |
6 |
6 |
3 |
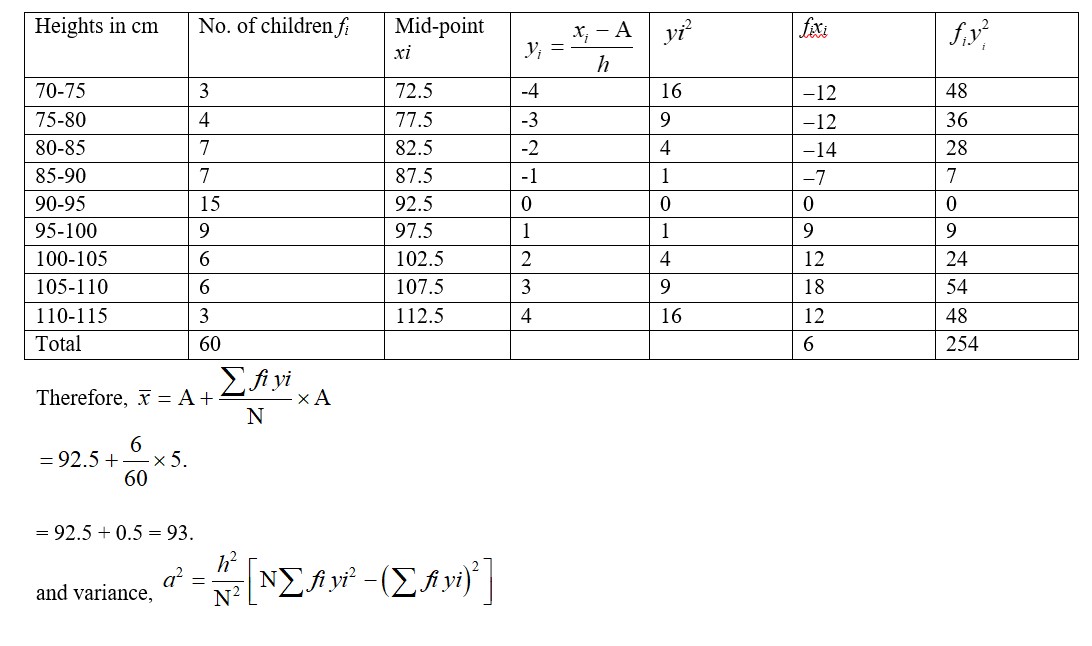
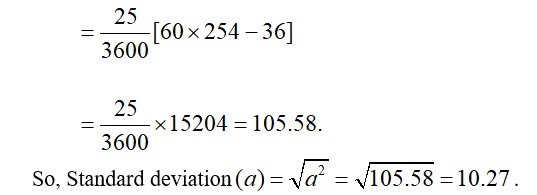
21. Let the assumed mean be A=92.5 and h=5
 Upvote
20.
Classes
0-10
10-20
20-30
30-40
40-50
Frequencies
5
8
15
16
6
20.
|
Classes |
0-10 |
10-20 |
20-30 |
30-40 |
40-50 |
|
Frequencies |
5 |
8 |
15 |
16 |
6 |
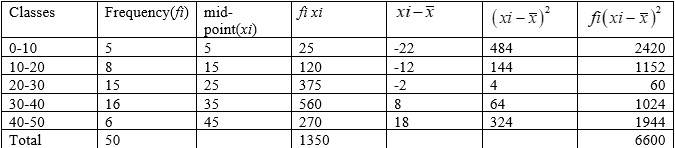

19. Find the mean and variance for the following frequency distributions in Exercises 19 and 20.
Classes
0-30
30-60
60-90
90-120
120-150
150-180
180-210
Frequencies
2
3
5
10
3
5
2
19. Find the mean and variance for the following frequency distributions in Exercises 19 and 20.
|
Classes |
0-30 |
30-60 |
60-90 |
90-120 |
120-150 |
150-180 |
180-210 |
|
Frequencies |
2 |
3 |
5 |
10 |
3 |
5 |
2 |
19. Let the assumed mean be A=105 and class width, h=30. The given data can be tabulated as
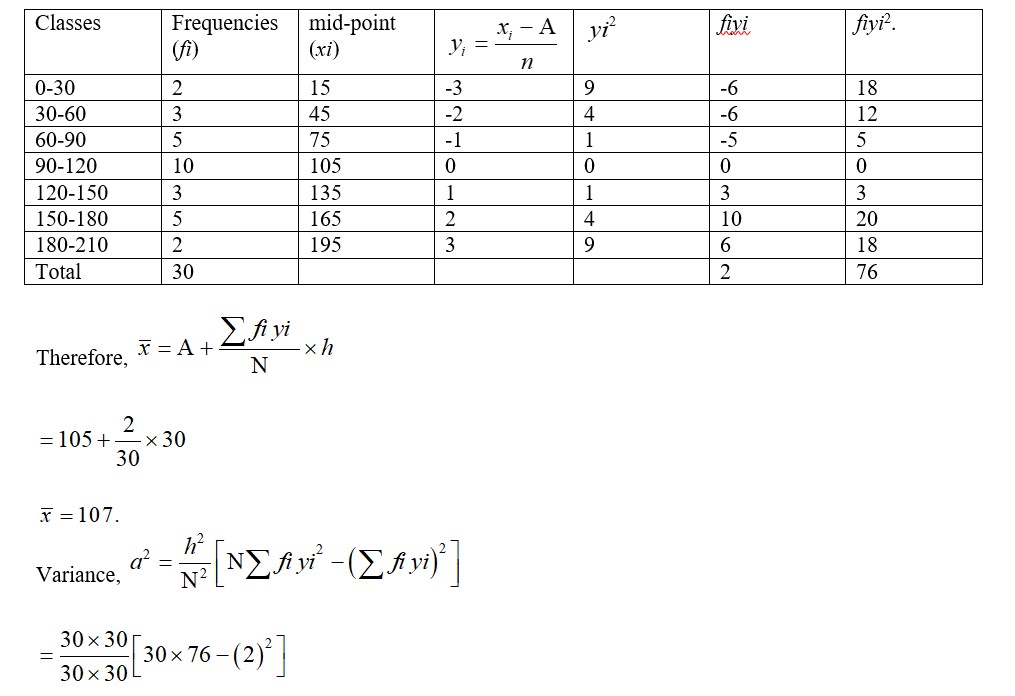
= 2280 - 4
= 2276.
Upvote <p><strong>19. Find the mean and variance for the following frequency distributions in Exercises 19 and 20.</strong></p>
18.Find the mean and standard deviation using short-cut method.
xi
60
61
62
63
64
65
66
67
68
fi
2
1
12
29
25
12
10
4
5
18.Find the mean and standard deviation using short-cut method.
|
xi |
60 |
61 |
62 |
63 |
64 |
65 |
66 |
67 |
68 |
|
fi |
2 |
1 |
12 |
29 |
25 |
12 |
10 |
4 |
5 |
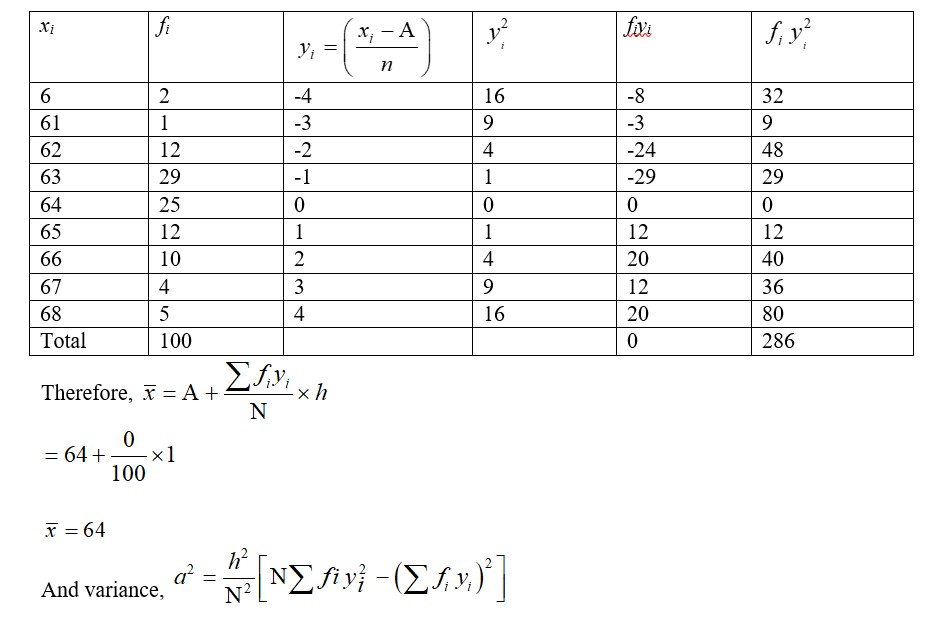
18. Let the assumed mean be A=64 and it the width, h=1.
 Upvote