
DILR Preparation Tips for MBA
Get insights from 171 questions on DILR Preparation Tips for MBA, answered by students, alumni, and experts. You may also ask and answer any question you like about DILR Preparation Tips for MBA
- 171
Questions
- 0
Discussions
- 0
Active Users
- 1
Followers
Have a question about DILR Preparation Tips for MBA? Ask our experts
Keep it short & simple. Type complete word. Avoid abusive language.
The following table gives the career record in the One-Day Internationals of few of the Indian batsmen:
Name
Matches Played
Innings Played
Runs Scored
Average
Rohit
50
48
1800
40
Gill
50
50
2034
45.2
Virat
46
46
1679
36.5
Shreyas
44
44
1539
40.5
Hardik
40
38
1806
51.6
Rahul
42
40
1445
42.5
The average is calculated by dividing the total runs scored by the total number of matches in which the batman got out.
To reflect the performance of the players better, it was decided that the average would be calculated on the basis of the total matches played. Whose average will see the minimum change due to this?
The following table gives the career record in the One-Day Internationals of few of the Indian batsmen:
|
Name |
Matches Played |
Innings Played |
Runs Scored |
Average |
|
Rohit |
50 |
48 |
1800 |
40 |
|
Gill |
50 |
50 |
2034 |
45.2 |
|
Virat |
46 |
46 |
1679 |
36.5 |
|
Shreyas |
44 |
44 |
1539 |
40.5 |
|
Hardik |
40 |
38 |
1806 |
51.6 |
|
Rahul |
42 |
40 |
1445 |
42.5 |
The average is calculated by dividing the total runs scored by the total number of matches in which the batman got out.
To reflect the performance of the players better, it was decided that the average would be calculated on the basis of the total matches played. Whose average will see the minimum change due to this?
Again, the difference is minimum in case of Virat
 Upvote

The following table gives the career record in the One-Day Internationals of few of the Indian batsmen:
Name
Matches Played
Innings Played
Runs Scored
Average
Rohit
50
48
1800
40
Gill
50
50
2034
45.2
Virat
46
46
1679
36.5
Shreyas
44
44
1539
40.5
Hardik
40
38
1806
51.6
Rahul
42
40
1445
42.5
The average is calculated by dividing the total runs scored by the total number of matches in which the batman got out.
How man of the batsmen got out in all the innings played?
The following table gives the career record in the One-Day Internationals of few of the Indian batsmen:
|
Name |
Matches Played |
Innings Played |
Runs Scored |
Average |
|
Rohit |
50 |
48 |
1800 |
40 |
|
Gill |
50 |
50 |
2034 |
45.2 |
|
Virat |
46 |
46 |
1679 |
36.5 |
|
Shreyas |
44 |
44 |
1539 |
40.5 |
|
Hardik |
40 |
38 |
1806 |
51.6 |
|
Rahul |
42 |
40 |
1445 |
42.5 |
The average is calculated by dividing the total runs scored by the total number of matches in which the batman got out.
How man of the batsmen got out in all the innings played?
Only Virat got out in all the innings played. Take the help of the solution to Q1
Upvote The following table gives the career record in the One-Day Internationals of few of the Indian batsmen:
Name
Matches Played
Innings Played
Runs Scored
Average
Rohit
50
48
1800
40
Gill
50
50
2034
45.2
Virat
46
46
1679
36.5
Shreyas
44
44
1539
40.5
Hardik
40
38
1806
51.6
Rahul
42
40
1445
42.5
The average is calculated by dividing the total runs scored by the total number of matches in which the batman got out.
To reflect the performance of the players better, it was decided that the average would be calculated on the basis of the total innings played. Whose average will see the maximum change due to this?
The following table gives the career record in the One-Day Internationals of few of the Indian batsmen:
|
Name |
Matches Played |
Innings Played |
Runs Scored |
Average |
|
Rohit |
50 |
48 |
1800 |
40 |
|
Gill |
50 |
50 |
2034 |
45.2 |
|
Virat |
46 |
46 |
1679 |
36.5 |
|
Shreyas |
44 |
44 |
1539 |
40.5 |
|
Hardik |
40 |
38 |
1806 |
51.6 |
|
Rahul |
42 |
40 |
1445 |
42.5 |
The average is calculated by dividing the total runs scored by the total number of matches in which the batman got out.
To reflect the performance of the players better, it was decided that the average would be calculated on the basis of the total innings played. Whose average will see the maximum change due to this?
The difference is maximum in case of Rahul
Upvote Directions for questions: Refer to the following chart and solve the questions based on it.
The following table gives the career record in the One-Day Internationals of few of the Indian batsmen:
Name
Matches Played
Innings Played
Runs Scored
Average
Rohit
50
48
1800
40
Gill
50
50
2034
45.2
Virat
46
46
1679
36.5
Shreyas
44
44
1539
40.5
Hardik
40
38
1806
51.6
Rahul
42
40
1445
42.5
The average is calculated by dividing the total runs scored by the total number of matches in which the batman got out.
Who among the following did not get out for the maximum amount of time in the total innings played?
Directions for questions: Refer to the following chart and solve the questions based on it.
The following table gives the career record in the One-Day Internationals of few of the Indian batsmen:
|
Name |
Matches Played |
Innings Played |
Runs Scored |
Average |
|
Rohit |
50 |
48 |
1800 |
40 |
|
Gill |
50 |
50 |
2034 |
45.2 |
|
Virat |
46 |
46 |
1679 |
36.5 |
|
Shreyas |
44 |
44 |
1539 |
40.5 |
|
Hardik |
40 |
38 |
1806 |
51.6 |
|
Rahul |
42 |
40 |
1445 |
42.5 |
The average is calculated by dividing the total runs scored by the total number of matches in which the batman got out.
Who among the following did not get out for the maximum amount of time in the total innings played?
Rohit – 1800840 = 45
Hence, not-out in 3 innings
Gill – 2034/45.2 = 45
Hence, not out in 0 inings
Virat – 1679/36.5= 46
Hence, not–out in 0 innings
Rahul – 1445/42.5 = 34
Hence, not-out in 6 innings
Therefore, option (d) is the correct answer
Upvote Directions for questions: Refer to the following table and solve the questions based on it.
The following table gives some incomplete information on the marks obtained by four persons Deepak, Dinesh, Dharam and Dhruv in four different subjects.
Reasoning
Data interpretation
Quantitative
Data sufficiency
Total
Deepak
80
70
-
80
-
Dinesh
60
-
60
-
-
Dharam
-
-
60
-
220
Dhruv
90
-
70
60
-
(i) Deepak’s average marks were 72.5, in all the four subjects.
(ii) The average marks in Reasoning for all four persons were 67.5.
(iii) Dinesh’s average marks for all four subjects were 1.5 times of Dharam’s marks in Reasoning.
(iv) Dinesh and Dhruv scored the same marks in Data sufficiency. The average Data sufficiency marks were the same as the average Reasoning marks.
(v) The total marks in Data interpretation were 10 less than the total marks in Reasoning for all four persons.
(vi) The maximum marks in each subject is 100.
Who scored the lowest total?
Directions for questions: Refer to the following table and solve the questions based on it.
The following table gives some incomplete information on the marks obtained by four persons Deepak, Dinesh, Dharam and Dhruv in four different subjects.
|
|
Reasoning |
Data interpretation |
Quantitative |
Data sufficiency |
Total |
|
Deepak |
80 |
70 |
- |
80 |
- |
|
Dinesh |
60 |
- |
60 |
- |
- |
|
Dharam |
- |
- |
60 |
- |
220 |
|
Dhruv |
90 |
- |
70 |
60 |
- |
(i) Deepak’s average marks were 72.5, in all the four subjects.
(ii) The average marks in Reasoning for all four persons were 67.5.
(iii) Dinesh’s average marks for all four subjects were 1.5 times of Dharam’s marks in Reasoning.
(iv) Dinesh and Dhruv scored the same marks in Data sufficiency. The average Data sufficiency marks were the same as the average Reasoning marks.
(v) The total marks in Data interpretation were 10 less than the total marks in Reasoning for all four persons.
(vi) The maximum marks in each subject is 100.
Who scored the lowest total?
| Physics | Chemistry | Maths | English | Total |
A | 80 | 70 | 60 | 80 | 290 |
B | 60 | 60 | 60 | 60 | 240 |
C | 40 | 50 | 60 | 70 | 220 |
D | 90 | 80 | 60 | 60 | 290 |
Upvote Refer to the following data-set and solve the questions based on it. Data Pertains to Paras Ltd.
Sector
Factories
Employment
Fixed capital
Variable cost
Value Added
Government
18
15
14
22
12
Central
8
6
5
7
10
State
4
6
4
8
3
Central/State
6
3
5
7
12
Public
12
8
6
19
8
Private
55
65
72
54
62
Joint
15
12
8
5
5
Total
100
100
100
100
100
Which of the following sectors has the maximum factories per factories?
Refer to the following data-set and solve the questions based on it. Data Pertains to Paras Ltd.
|
Sector |
Factories |
Employment |
Fixed capital |
Variable cost |
Value Added |
|
Government |
18 |
15 |
14 |
22 |
12 |
|
Central |
8 |
6 |
5 |
7 |
10 |
|
State |
4 |
6 |
4 |
8 |
3 |
|
Central/State |
6 |
3 |
5 |
7 |
12 |
|
Public |
12 |
8 |
6 |
19 |
8 |
|
Private |
55 |
65 |
72 |
54 |
62 |
|
Joint |
15 |
12 |
8 |
5 |
5 |
|
Total |
100 |
100 |
100 |
100 |
100 |
Which of the following sectors has the maximum factories per factories?
Refer to the following data-set and solve the questions based on it. Data Pertains to Paras Ltd.
Sector
Factories
Employment
Fixed capital
Variable cost
Value Added
Government
18
15
14
22
12
Central
8
6
5
7
10
State
4
6
4
8
3
Central/State
6
3
5
7
12
Public
12
8
6
19
8
Private
55
65
72
54
62
Joint
15
12
8
5
5
Total
100
100
100
100
100
Which of the following statement is true?
Refer to the following data-set and solve the questions based on it. Data Pertains to Paras Ltd.
|
Sector |
Factories |
Employment |
Fixed capital |
Variable cost |
Value Added |
|
Government |
18 |
15 |
14 |
22 |
12 |
|
Central |
8 |
6 |
5 |
7 |
10 |
|
State |
4 |
6 |
4 |
8 |
3 |
|
Central/State |
6 |
3 |
5 |
7 |
12 |
|
Public |
12 |
8 |
6 |
19 |
8 |
|
Private |
55 |
65 |
72 |
54 |
62 |
|
Joint |
15 |
12 |
8 |
5 |
5 |
|
Total |
100 |
100 |
100 |
100 |
100 |
Which of the following statement is true?
Neither of the statements (a) or (b) can be inferred, as we know only the percentages and not the actual values of the employee, factories or fixed capital.
Upvote Refer to the following data-set and solve the questions based on it. Data Pertains to Paras Ltd.
Sector
Factories
Employment
Fixed capital
Variable cost
Value Added
Government
18
15
14
22
12
Central
8
6
5
7
10
State
4
6
4
8
3
Central/State
6
3
5
7
12
Public
12
8
6
19
8
Private
55
65
72
54
62
Joint
15
12
8
5
5
Total
100
100
100
100
100
Which of the following sectors has the maximum fixed capital invested per factory?
Refer to the following data-set and solve the questions based on it. Data Pertains to Paras Ltd.
|
Sector |
Factories |
Employment |
Fixed capital |
Variable cost |
Value Added |
|
Government |
18 |
15 |
14 |
22 |
12 |
|
Central |
8 |
6 |
5 |
7 |
10 |
|
State |
4 |
6 |
4 |
8 |
3 |
|
Central/State |
6 |
3 |
5 |
7 |
12 |
|
Public |
12 |
8 |
6 |
19 |
8 |
|
Private |
55 |
65 |
72 |
54 |
62 |
|
Joint |
15 |
12 |
8 |
5 |
5 |
|
Total |
100 |
100 |
100 |
100 |
100 |
Which of the following sectors has the maximum fixed capital invested per factory?
Fixed capital per factory will be proportional to the following ratios:
Central | 5/8 |
State | 4/4 |
Central/state | 5/6 |
Public | 6/12 |
Upvote Directions for question: Refer to the following data-set and solve the questions based on it. Data Pertains to Paras Ltd.
Sector
Factories
Employment
Fixed capital
Variable cost
Value Added
Government
18
15
14
22
12
Central
8
6
5
7
10
State
4
6
4
8
3
Central/State
6
3
5
7
12
Public
12
8
6
19
8
Private
55
65
72
54
62
Joint
15
12
8
5
5
Total
100
100
100
100
100
If the total work force was 76 million, whereas the total values added were 225 million, then which of the following had the maximum value addition per worker?
Directions for question: Refer to the following data-set and solve the questions based on it. Data Pertains to Paras Ltd.
|
Sector |
Factories |
Employment |
Fixed capital |
Variable cost |
Value Added |
|
Government |
18 |
15 |
14 |
22 |
12 |
|
Central |
8 |
6 |
5 |
7 |
10 |
|
State |
4 |
6 |
4 |
8 |
3 |
|
Central/State |
6 |
3 |
5 |
7 |
12 |
|
Public |
12 |
8 |
6 |
19 |
8 |
|
Private |
55 |
65 |
72 |
54 |
62 |
|
Joint |
15 |
12 |
8 |
5 |
5 |
|
Total |
100 |
100 |
100 |
100 |
100 |
If the total work force was 76 million, whereas the total values added were 225 million, then which of the following had the maximum value addition per worker?
Values added per worker for various sector will be proportional to the following ratio:
Central | 10/6 |
State | 3/6 |
Central/state | 12/3 |
Public | 8/8 |
Upvote The figure below represents sales and net profit (in Rs. crore) of IVP Ltd., for five years from 2014-2015 to 2018-2019. During this period, the sales increased from Rs. 100 crore to Rs. 680 crore. Correspondingly, the net profit increased from Rs. 2.5 crore to Rs. 12 crore. (Net profit is defined as the excess of sales over total costs.)
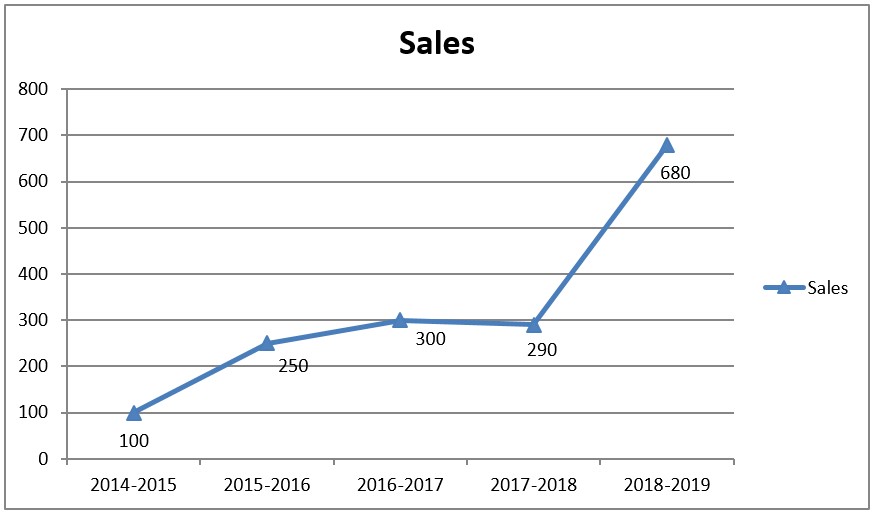
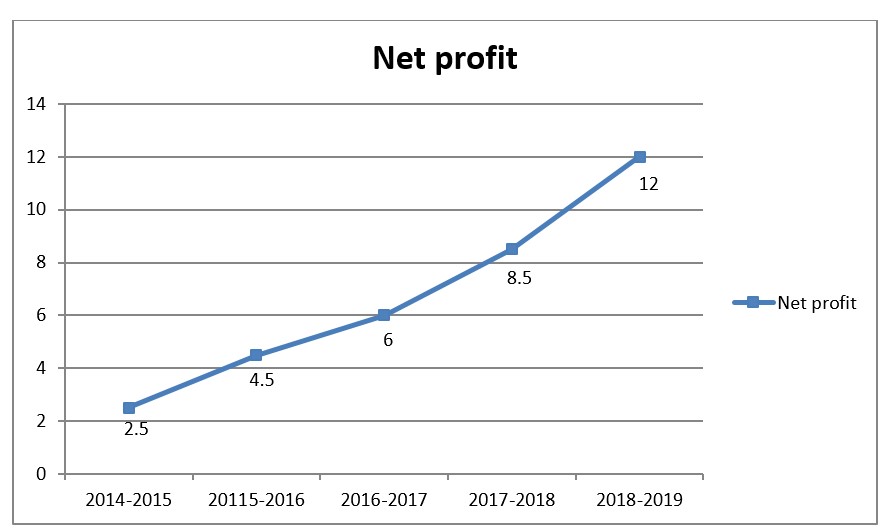
Defining profitability as the ratio of net profit to sales, IVP Ltd recorded the highest profitability in ______.
The figure below represents sales and net profit (in Rs. crore) of IVP Ltd., for five years from 2014-2015 to 2018-2019. During this period, the sales increased from Rs. 100 crore to Rs. 680 crore. Correspondingly, the net profit increased from Rs. 2.5 crore to Rs. 12 crore. (Net profit is defined as the excess of sales over total costs.)
Defining profitability as the ratio of net profit to sales, IVP Ltd recorded the highest profitability in ______.
| Net profit | Net sales | Ratio |
2014-15 | 2.5 | 100 | 0.025 |
2015-16 | 4.5 | 250 | 0.02 |
2016-17 | 6 | 300 | 0.02 |
2017-18 | 8.5 | 290 | 0.03 |
2018-19 | 12 | 680 | 0.018 |
Therefore, profitability is maximum for 1997-1998]
Upvote