
DILR Preparation Tips for MBA
Get insights from 171 questions on DILR Preparation Tips for MBA, answered by students, alumni, and experts. You may also ask and answer any question you like about DILR Preparation Tips for MBA
- 171
Questions
- 0
Discussions
- 0
Active Users
- 1
Followers
Have a question about DILR Preparation Tips for MBA? Ask our experts
Keep it short & simple. Type complete word. Avoid abusive language.
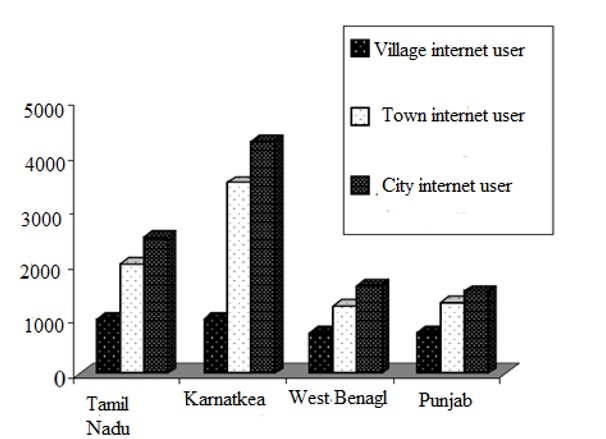
The following bar chart gives the increase in internet user percentage of villages, towns and cities in the four states for the period between 2018-19 and 2020-21. The table provides information about the number of households who uses internet, average expenditure by a household and growth on expenditure on internet by a household.
<!--[endif]-->
Number of households in 1987-88 (in thousands)
Average expenditure by house hold in internet on 2018-19
Growth in average household expenditure on internet (2018-19 over 2019-20)
Village
400
Rs. 30,00
50%
Town
100
Rs. 50,00
60%
City
50
Rs. 75,00
90%
The total expenditure on the internet in the cities than the town increased by how much percentage in year 2018-19?
The following bar chart gives the increase in internet user percentage of villages, towns and cities in the four states for the period between 2018-19 and 2020-21. The table provides information about the number of households who uses internet, average expenditure by a household and growth on expenditure on internet by a household.
<!--[endif]-->
|
|
Number of households in 1987-88 (in thousands) |
Average expenditure by house hold in internet on 2018-19 |
Growth in average household expenditure on internet (2018-19 over 2019-20) |
|
Village |
400 |
Rs. 30,00 |
50% |
|
Town |
100 |
Rs. 50,00 |
60% |
|
City |
50 |
Rs. 75,00 |
90% |
The total expenditure on the internet in the cities than the town increased by how much percentage in year 2018-19?
Total expenditure on internet by cities users = 7500 × 50000 = 375000000
Total expenditure on internet by town users = 5000 × 100000 = 50000000
= = 25%
 Upvote

The following bar chart gives the increase in internet user percentage of villages, towns and cities in the four states for the period between 2018-19 and 2020-21. The table provides information about the number of households who uses internet, average expenditure by a household and growth on expenditure on internet by a household.
Number of households in 1987-88 (in thousands)
Average expenditure by house hold in internet on 2018-19
Growth in average household expenditure on internet (2018-19 over 2019-20)
Village
400
Rs. 30,00
50%
Town
100
Rs. 50,00
60%
City
50
Rs. 75,00
90%
What is the percentage increase in total numbers of households that uses internet in towns of Tamil Nadu’s over the given periods ?
The following bar chart gives the increase in internet user percentage of villages, towns and cities in the four states for the period between 2018-19 and 2020-21. The table provides information about the number of households who uses internet, average expenditure by a household and growth on expenditure on internet by a household.
|
|
Number of households in 1987-88 (in thousands) |
Average expenditure by house hold in internet on 2018-19 |
Growth in average household expenditure on internet (2018-19 over 2019-20) |
|
Village |
400 |
Rs. 30,00 |
50% |
|
Town |
100 |
Rs. 50,00 |
60% |
|
City |
50 |
Rs. 75,00 |
90% |
What is the percentage increase in total numbers of households that uses internet in towns of Tamil Nadu’s over the given periods ?
The percentage increase in total number of households that uses internet in Tamil Nadu is 200%.
Upvote Directions: Answer the questions based on the following Information.
The following bar chart gives the increase in internet user percentage of villages, towns and cities in the four states for the period between 2018-19 and 2020-21. The table provides information about the number of households who uses internet, average expenditure by a household and growth on expenditure on internet by a household.
<!--[endif]-->
Number of households in 1987-88 (in thousands)
Average expenditure by house hold in internet on 2018-19
Growth in average household expenditure on internet (2018-19 over 2019-20)
Village
400
Rs. 30,00
50%
Town
100
Rs. 50,00
60%
City
50
Rs. 75,00
90%
What was the total households expenditure on internet in towns of Tamil Nadu‘s town who uses internet?
Directions: Answer the questions based on the following Information.
The following bar chart gives the increase in internet user percentage of villages, towns and cities in the four states for the period between 2018-19 and 2020-21. The table provides information about the number of households who uses internet, average expenditure by a household and growth on expenditure on internet by a household.
<!--[endif]-->
|
|
Number of households in 1987-88 (in thousands) |
Average expenditure by house hold in internet on 2018-19 |
Growth in average household expenditure on internet (2018-19 over 2019-20) |
|
Village |
400 |
Rs. 30,00 |
50% |
|
Town |
100 |
Rs. 50,00 |
60% |
|
City |
50 |
Rs. 75,00 |
90% |
What was the total households expenditure on internet in towns of Tamil Nadu‘s town who uses internet?
Statewise breakup is not available. Hence, question cannot be answered.
Upvote The first table gives the percentage of employees in skyroot, who work in the department of finance marketing and software. The second table gives the average starting salaries of the employees per month (Rs. in thousands) in these. The line graph gives the no. of employees who are working for Skyroot each year.
First Table
Finance
Marketing
Software
Others
2016
22
36
19
23
2017
17
48
23
12
2018
23
42
21
13
2019
19
37
16
28
2020
32
32
20
16
Second Table
Finance
Marketing
Software
2016
54500
51700
52900
2017
63800
63900
64400
2018
75500
76300
70500
2019
89200
89600
77600
2020
92100
102200
86400
<!--[endif]-->
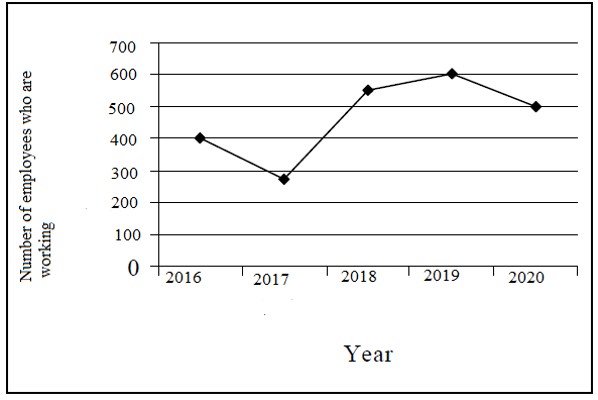
In 2018 employees working in finance department earned more than those working for software (per annum)?
The first table gives the percentage of employees in skyroot, who work in the department of finance marketing and software. The second table gives the average starting salaries of the employees per month (Rs. in thousands) in these. The line graph gives the no. of employees who are working for Skyroot each year.
|
First Table |
||||
|
|
Finance |
Marketing |
Software |
Others |
|
2016 |
22 |
36 |
19 |
23 |
|
2017 |
17 |
48 |
23 |
12 |
|
2018 |
23 |
42 |
21 |
13 |
|
2019 |
19 |
37 |
16 |
28 |
|
2020 |
32 |
32 |
20 |
16 |
|
|
||||
|
|
Second Table |
|||
|
|
|
Finance |
Marketing |
Software |
|
|
2016 |
54500 |
51700 |
52900 |
|
|
2017 |
63800 |
63900 |
64400 |
|
|
2018 |
75500 |
76300 |
70500 |
|
|
2019 |
89200 |
89600 |
77600 |
|
|
2020 |
92100 |
102200 |
86400 |
<!--[endif]-->
In 2018 employees working in finance department earned more than those working for software (per annum)?
Earning of employee in finance =
= 9550750
Earning of employee working in software department =
Difference in the amount earned = 9550750 – 8720250 = 830500
Upvote The first table gives the percentage of employees in skyroot, who work in the department of finance marketing and software. The second table gives the average starting salaries of the employees per month (Rs. in thousands) in these. The line graph gives the no. of employees who are working for Skyroot each year.
First Table
Finance
Marketing
Software
Others
2016
22
36
19
23
2017
17
48
23
12
2018
23
42
21
13
2019
19
37
16
28
2020
32
32
20
16
Second Table
Finance
Marketing
Software
2016
54500
51700
52900
2017
63800
63900
64400
2018
75500
76300
70500
2019
89200
89600
77600
2020
92100
102200
86400
What is the percentage increase in the average salary of finance employee from 2016 to 2020 ?
The first table gives the percentage of employees in skyroot, who work in the department of finance marketing and software. The second table gives the average starting salaries of the employees per month (Rs. in thousands) in these. The line graph gives the no. of employees who are working for Skyroot each year.
|
First Table |
||||
|
|
Finance |
Marketing |
Software |
Others |
|
2016 |
22 |
36 |
19 |
23 |
|
2017 |
17 |
48 |
23 |
12 |
|
2018 |
23 |
42 |
21 |
13 |
|
2019 |
19 |
37 |
16 |
28 |
|
2020 |
32 |
32 |
20 |
16 |
|
|
||||
|
|
Second Table |
|||
|
|
|
Finance |
Marketing |
Software |
|
|
2016 |
54500 |
51700 |
52900 |
|
|
2017 |
63800 |
63900 |
64400 |
|
|
2018 |
75500 |
76300 |
70500 |
|
|
2019 |
89200 |
89600 |
77600 |
|
|
2020 |
92100 |
102200 |
86400 |
What is the percentage increase in the average salary of finance employee from 2016 to 2020 ?
Percentage increase in the average salary of finance
Upvote Directions: Answer the questions based on the following Information.
The first table gives the percentage of employees in skyroot, who work in the department of finance marketing and software. The second table gives the average starting salaries of the employees per month (Rs. in thousands) in these. The line graph gives the no. of employees who are working for Skyroot each year.
First Table
Finance
Marketing
Software
Others
2016
22
36
19
23
2017
17
48
23
12
2018
23
42
21
13
2019
19
37
16
28
2020
32
32
20
16
Second Table
Finance
Marketing
Software
2016
54500
51700
52900
2017
63800
63900
64400
2018
75500
76300
70500
2019
89200
89600
77600
2020
92100
102200
86400
<!--[endif]-->
The averagre annual rate at which the initial salary offer in software increases from 2016 to 2020?
Directions: Answer the questions based on the following Information.
The first table gives the percentage of employees in skyroot, who work in the department of finance marketing and software. The second table gives the average starting salaries of the employees per month (Rs. in thousands) in these. The line graph gives the no. of employees who are working for Skyroot each year.
|
First Table |
||||
|
|
Finance |
Marketing |
Software |
Others |
|
2016 |
22 |
36 |
19 |
23 |
|
2017 |
17 |
48 |
23 |
12 |
|
2018 |
23 |
42 |
21 |
13 |
|
2019 |
19 |
37 |
16 |
28 |
|
2020 |
32 |
32 |
20 |
16 |
|
|
||||
|
|
Second Table |
|||
|
|
|
Finance |
Marketing |
Software |
|
|
2016 |
54500 |
51700 |
52900 |
|
|
2017 |
63800 |
63900 |
64400 |
|
|
2018 |
75500 |
76300 |
70500 |
|
|
2019 |
89200 |
89600 |
77600 |
|
|
2020 |
92100 |
102200 |
86400 |
<!--[endif]-->
The averagre annual rate at which the initial salary offer in software increases from 2016 to 2020?
Average rate =
= 12.667% = 13% (apporx.)
Upvote Directions for questions: Answer the following questions based on the information given below.
A manufacturing company’s make various alloys, which is be used for certain specific purposes. It is considering a choice of 5 new alloys (A1, A2, A3, A4, and A5), which can be used in different proportions in the formulations. The table below gives the composition of these alloys. The cost per unit of each of these alloys is A1: 150, A2: 50, A3: 200, A4: 500, A5: 100
Composition
Alloys
Cobalt
Iron
Aluminum
Carbon
A1
50
30
10
10
A2
80
20
0
0
A3
10
30
50
10
A4
5
50
40
5
A5
45
50
0
5
In what proportion should A2, A3 and A5 be mixed to make a new alloy having at least 60% i at the lowest per unit cost?
Directions for questions: Answer the following questions based on the information given below.
A manufacturing company’s make various alloys, which is be used for certain specific purposes. It is considering a choice of 5 new alloys (A1, A2, A3, A4, and A5), which can be used in different proportions in the formulations. The table below gives the composition of these alloys. The cost per unit of each of these alloys is A1: 150, A2: 50, A3: 200, A4: 500, A5: 100
|
Composition |
||||
|
Alloys |
Cobalt |
Iron |
Aluminum |
Carbon |
|
A1 |
50 |
30 |
10 |
10 |
|
A2 |
80 |
20 |
0 |
0 |
|
A3 |
10 |
30 |
50 |
10 |
|
A4 |
5 |
50 |
40 |
5 |
|
A5 |
45 |
50 |
0 |
5 |
In what proportion should A2, A3 and A5 be mixed to make a new alloy having at least 60% i at the lowest per unit cost?
To make a new alloy with atleast 60% Cobalt we can use option (b) or (d) only but the lowest cost per unit can be achieved when A2, A3 and A5 are mixed in the ratio 4 : 1 : 1.
Upvote Directions for questions: Answer the following questions based on the information given below.
A manufacturing company’s make various alloys, which is be used for certain specific purposes. It is considering a choice of 5 new alloys (A1, A2, A3, A4, and A5), which can be used in different proportions in the formulations. The table below gives the composition of these alloys. The cost per unit of each of these alloys is A1: 150, A2: 50, A3: 200, A4: 500, A5: 100
Composition
Alloys
Cobalt
Iron
Aluminum
Carbon
A1
50
30
10
10
A2
80
20
0
0
A3
10
30
50
10
A4
5
50
40
5
A5
45
50
0
5
For making engines, the alloy should containing 10% carbon and at least 30% iron. In how many different ways can we prepare this new alloy by mixing at least two of the given alloys?
Directions for questions: Answer the following questions based on the information given below.
A manufacturing company’s make various alloys, which is be used for certain specific purposes. It is considering a choice of 5 new alloys (A1, A2, A3, A4, and A5), which can be used in different proportions in the formulations. The table below gives the composition of these alloys. The cost per unit of each of these alloys is A1: 150, A2: 50, A3: 200, A4: 500, A5: 100
|
Composition |
||||
|
Alloys |
Cobalt |
Iron |
Aluminum |
Carbon |
|
A1 |
50 |
30 |
10 |
10 |
|
A2 |
80 |
20 |
0 |
0 |
|
A3 |
10 |
30 |
50 |
10 |
|
A4 |
5 |
50 |
40 |
5 |
|
A5 |
45 |
50 |
0 |
5 |
For making engines, the alloy should containing 10% carbon and at least 30% iron. In how many different ways can we prepare this new alloy by mixing at least two of the given alloys?
As the new alloy should contain 10% carbon and only two alloy contains 10% carbon i.e. A1 and A3. Hence, only by mixing A1 and A3 a new alloy with 10% carbon can be formed. Hence, there is only one way.
Upvote Directions for questions: Answer the following questions based on the information given below.
A manufacturing company’s make various alloys, which is be used for certain specific purposes. It is considering a choice of 5 new alloys (A1, A2, A3, A4, and A5), which can be used in different proportions in the formulations. The table below gives the composition of these alloys. The cost per unit of each of these alloys is A1: 150, A2: 50, A3: 200, A4: 500, A5: 100
Composition
Alloys
Cobalt
Iron
Aluminum
Carbon
A1
50
30
10
10
A2
80
20
0
0
A3
10
30
50
10
A4
5
50
40
5
A5
45
50
0
5
The company is planning to make a new alloy required for making ships. This new alloy must contain at least 30% each of cobalt and iron, no more than 25% aluminum and at least 5% carbon. Which one of the following combinations of equally mixed alloys is feasible?
Directions for questions: Answer the following questions based on the information given below.
A manufacturing company’s make various alloys, which is be used for certain specific purposes. It is considering a choice of 5 new alloys (A1, A2, A3, A4, and A5), which can be used in different proportions in the formulations. The table below gives the composition of these alloys. The cost per unit of each of these alloys is A1: 150, A2: 50, A3: 200, A4: 500, A5: 100
|
Composition |
||||
|
Alloys |
Cobalt |
Iron |
Aluminum |
Carbon |
|
A1 |
50 |
30 |
10 |
10 |
|
A2 |
80 |
20 |
0 |
0 |
|
A3 |
10 |
30 |
50 |
10 |
|
A4 |
5 |
50 |
40 |
5 |
|
A5 |
45 |
50 |
0 |
5 |
The company is planning to make a new alloy required for making ships. This new alloy must contain at least 30% each of cobalt and iron, no more than 25% aluminum and at least 5% carbon. Which one of the following combinations of equally mixed alloys is feasible?
As the alloys are fixed in equal amounts, so we can take the average of the constituent percentage of the metal used. A1nly option A1 and A5 satisfies all the conditions.
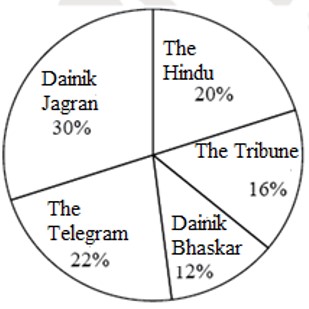
Upvote The pie chart given below shows the total number of people and the number of women who reads 5 different news paper.
Percentage of people who reads different newspaper in a town
Total number of people = 35,000
Percentage break-up of female who reads different newspaper in town
Total number of females = 15,000
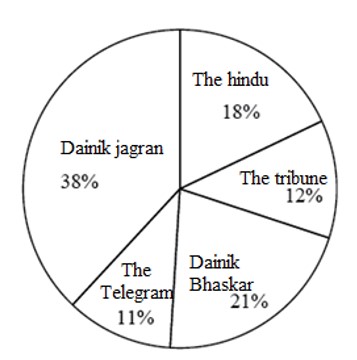
The number of females who reads dainik jagran, the telegram and dainik bhaskar forms what percent of total number of people in the town?
The pie chart given below shows the total number of people and the number of women who reads 5 different news paper.
Percentage of people who reads different newspaper in a town
Total number of people = 35,000
Percentage break-up of female who reads different newspaper in town
Total number of females = 15,000
The number of females who reads dainik jagran, the telegram and dainik bhaskar forms what percent of total number of people in the town?
The number of females who eats Dainik Jagran, The telegram and Dainik Bhaskar:
= (38 + 11 + 21) × 150 = 10500
Required percent
Upvote