
DILR Preparation Tips for MBA
Get insights from 171 questions on DILR Preparation Tips for MBA, answered by students, alumni, and experts. You may also ask and answer any question you like about DILR Preparation Tips for MBA
- 171
Questions
- 0
Discussions
- 0
Active Users
- 1
Followers
Have a question about DILR Preparation Tips for MBA? Ask our experts
Keep it short & simple. Type complete word. Avoid abusive language.
Directions for questions: Answer the following questions based on the information given below.<!--[endif]-->
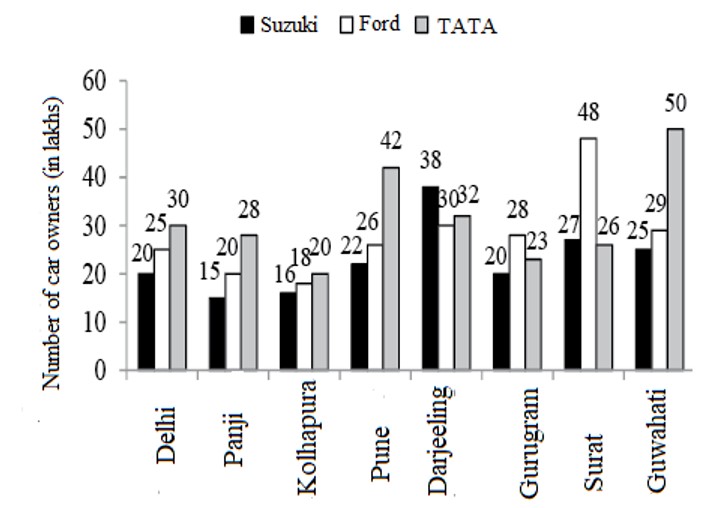
The above graph shows the number of cars owners of three different company in eight different states of India.
In how many cities in India were there more than 13% of the total TATA cars owners in the country? Assume no other city besides the given eight cities has TATA cars owners.
Directions for questions: Answer the following questions based on the information given below.<!--[endif]-->
The above graph shows the number of cars owners of three different company in eight different states of India.
In how many cities in India were there more than 13% of the total TATA cars owners in the country? Assume no other city besides the given eight cities has TATA cars owners.
Number of total car owners of TATA = 30 + 20 + 24 + 42 + 23 + 33 + 26 + 50 = 251 lakh
Now, 13% of 251 = 32.63 lakh
Those states which enjoy more than 34.45 Lacs car owners of TATA are Pune and Guwahati.
 Upvote

The bar graph given below shows the income of five doctors in year 2018-19 and 2019-20.
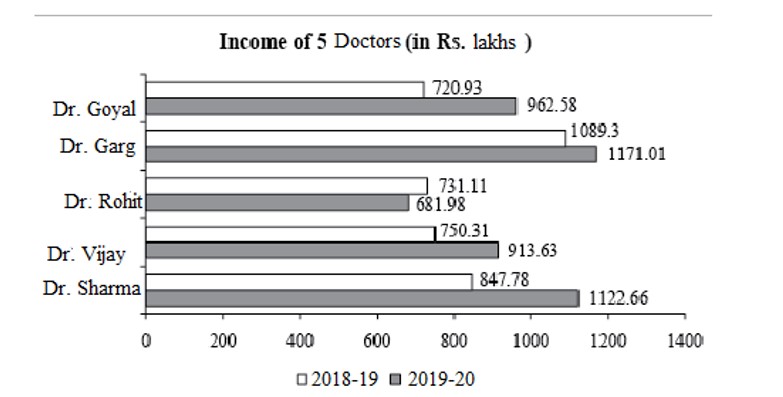
What is the absolute change in the overall incomes of all the five doctors taken together between 2019-20 to 2018-19?
The bar graph given below shows the income of five doctors in year 2018-19 and 2019-20.
What is the absolute change in the overall incomes of all the five doctors taken together between 2019-20 to 2018-19?
(Sum of the incomes in 2019-20) – (Sum of income in 2018-19)
= 4851.86 – 4139.43
= 712.43
Upvote The bar graph given below shows the income of five doctors in year 2018-19 and 2019-20.
Which of the players shows the maximum percentage difference in incomes between the two years?
The bar graph given below shows the income of five doctors in year 2018-19 and 2019-20.
Which of the players shows the maximum percentage difference in incomes between the two years?
Clearly, from the graph it could be either Dr. Sharma or Dr. Goyal.
For Dr. Sharma
For Dr. Goyal
Hence, Dr. Goyal’s turnover is maximum.
Upvote Directions for questions: Answer the following questions based on the information given below.
The bar graph given below shows the income of five doctors in year 2018-19 and 2019-20.
What is the approximate difference between the average income of all the doctors put together between the year 2019-20 and 2018-19?
Directions for questions: Answer the following questions based on the information given below.
The bar graph given below shows the income of five doctors in year 2018-19 and 2019-20.
What is the approximate difference between the average income of all the doctors put together between the year 2019-20 and 2018-19?
Average income for 2019-20
= 970.372
Average income for 2018-19
= 827.886
Thus, difference = 970.372 – 827.886 = 142.48
Upvote The table given below shows the annual expenditure (in crores) spend by 5 different countries on their vaccination program for children.
(in crores) Countries
2015
2016
2017
2018
2019
2020
2021
Nigeria
3387
4167
4500
5769
6354
8394
9300
UK
584793
747609
798294
976788
1314684
1779978
2285862
Egypt
107001
127137
130083
147750
171255
226686
285288
France
1252830
1437747
1210488
1250178
1415451
1697025
1784715
Italy
431085
344534
451317
487413
581451
761535
853257
Sri Lanka
3408
4938
7143
9138
7449
7140
8775
Austria
344040
413412
365253
375531
479706
595911
688947
Brazil
175320
207171
194904
204324
240972
288744
330330
Portugal
34620
43347
45087
49590
60528
76875
94875
If the annual expenditure of Austria country increased by 40 percent for the year 2017 how many countries will have expenditure more than the new expenditure of Austria country on vaccination program for children for the particular year.
The table given below shows the annual expenditure (in crores) spend by 5 different countries on their vaccination program for children.
|
(in crores) Countries |
2015 |
2016 |
2017 |
2018 |
2019 |
2020 |
2021 |
|
Nigeria |
3387 |
4167 |
4500 |
5769 |
6354 |
8394 |
9300 |
|
UK |
584793 |
747609 |
798294 |
976788 |
1314684 |
1779978 |
2285862 |
|
Egypt |
107001 |
127137 |
130083 |
147750 |
171255 |
226686 |
285288 |
|
France |
1252830 |
1437747 |
1210488 |
1250178 |
1415451 |
1697025 |
1784715 |
|
Italy |
431085 |
344534 |
451317 |
487413 |
581451 |
761535 |
853257 |
|
Sri Lanka |
3408 |
4938 |
7143 |
9138 |
7449 |
7140 |
8775 |
|
Austria |
344040 |
413412 |
365253 |
375531 |
479706 |
595911 |
688947 |
|
Brazil |
175320 |
207171 |
194904 |
204324 |
240972 |
288744 |
330330 |
|
Portugal |
34620 |
43347 |
45087 |
49590 |
60528 |
76875 |
94875 |
If the annual expenditure of Austria country increased by 40 percent for the year 2017 how many countries will have expenditure more than the new expenditure of Austria country on vaccination program for children for the particular year.
New expenditure of C7
= 1.4*365253
= 511354.2
Expenditure of Nigeria = 798294
Nigeria > C7
Expenditure of France= 1210988
France > Austria,
Upvote The table given below shows the annual expenditure (in crores) spend by 5 different countries on their vaccination program for children.
(in crores) Countries
2015
2016
2017
2018
2019
2020
2021
Nigeria
3387
4167
4500
5769
6354
8394
9300
UK
584793
747609
798294
976788
1314684
1779978
2285862
Egypt
107001
127137
130083
147750
171255
226686
285288
France
1252830
1437747
1210488
1250178
1415451
1697025
1784715
Italy
431085
344534
451317
487413
581451
761535
853257
Sri Lanka
3408
4938
7143
9138
7449
7140
8775
Austria
344040
413412
365253
375531
479706
595911
688947
Brazil
175320
207171
194904
204324
240972
288744
330330
Portugal
34620
43347
45087
49590
60528
76875
94875
According to the given data which of the following statement is true?
The table given below shows the annual expenditure (in crores) spend by 5 different countries on their vaccination program for children.
|
(in crores) Countries |
2015 |
2016 |
2017 |
2018 |
2019 |
2020 |
2021 |
|
Nigeria |
3387 |
4167 |
4500 |
5769 |
6354 |
8394 |
9300 |
|
UK |
584793 |
747609 |
798294 |
976788 |
1314684 |
1779978 |
2285862 |
|
Egypt |
107001 |
127137 |
130083 |
147750 |
171255 |
226686 |
285288 |
|
France |
1252830 |
1437747 |
1210488 |
1250178 |
1415451 |
1697025 |
1784715 |
|
Italy |
431085 |
344534 |
451317 |
487413 |
581451 |
761535 |
853257 |
|
Sri Lanka |
3408 |
4938 |
7143 |
9138 |
7449 |
7140 |
8775 |
|
Austria |
344040 |
413412 |
365253 |
375531 |
479706 |
595911 |
688947 |
|
Brazil |
175320 |
207171 |
194904 |
204324 |
240972 |
288744 |
330330 |
|
Portugal |
34620 |
43347 |
45087 |
49590 |
60528 |
76875 |
94875
|
According to the given data which of the following statement is true?
The difference between the growth rate of UK & France during 2020 – 21 was (28.4 – 5.1) = 23.3% while Vietnam's exports growth rate is 23.4%.
Upvote The table given below shows the annual expenditure (in crores) spend by 5 different countries on their vaccination program for children.
(in crores) Countries
2015
2016
2017
2018
2019
2020
2021
Nigeria
3387
4167
4500
5769
6354
8394
9300
UK
584793
747609
798294
976788
1314684
1779978
2285862
Egypt
107001
127137
130083
147750
171255
226686
285288
France
1252830
1437747
1210488
1250178
1415451
1697025
1784715
Italy
431085
344534
451317
487413
581451
761535
853257
Sri Lanka
3408
4938
7143
9138
7449
7140
8775
Austria
344040
413412
365253
375531
479706
595911
688947
Brazil
175320
207171
194904
204324
240972
288744
330330
Portugal
34620
43347
45087
49590
60528
76875
94875
According to the given data which of the following statements are not true?
The table given below shows the annual expenditure (in crores) spend by 5 different countries on their vaccination program for children.
|
(in crores) Countries |
2015 |
2016 |
2017 |
2018 |
2019 |
2020 |
2021 |
|
Nigeria |
3387 |
4167 |
4500 |
5769 |
6354 |
8394 |
9300 |
|
UK |
584793 |
747609 |
798294 |
976788 |
1314684 |
1779978 |
2285862 |
|
Egypt |
107001 |
127137 |
130083 |
147750 |
171255 |
226686 |
285288 |
|
France |
1252830 |
1437747 |
1210488 |
1250178 |
1415451 |
1697025 |
1784715 |
|
Italy |
431085 |
344534 |
451317 |
487413 |
581451 |
761535 |
853257 |
|
Sri Lanka |
3408 |
4938 |
7143 |
9138 |
7449 |
7140 |
8775 |
|
Austria |
344040 |
413412 |
365253 |
375531 |
479706 |
595911 |
688947 |
|
Brazil |
175320 |
207171 |
194904 |
204324 |
240972 |
288744 |
330330 |
|
Portugal |
34620 |
43347 |
45087 |
49590 |
60528 |
76875 |
94875 |
According to the given data which of the following statements are not true?
From statement (I), the table, we can observe that Myanmar has the highest annual growth
Statement (II), in interval 2019-20, Egyptn has second the highest growth rate, while Nigeria have the highest growth.
Statement (III), Nigeria register third the highest growth is wrong because it exhibits 28.2%
Upvote Directions for questions: Answer the questions on the basis of the information given below.
The table given below shows the annual expenditure (in crores) spend by 5 different countries on their vaccination program for children.
(in crores) Countries
2015
2016
2017
2018
2019
2020
2021
Nigeria
3387
4167
4500
5769
6354
8394
9300
UK
584793
747609
798294
976788
1314684
1779978
2285862
Egypt
107001
127137
130083
147750
171255
226686
285288
France
1252830
1437747
1210488
1250178
1415451
1697025
1784715
Italy
431085
344534
451317
487413
581451
761535
853257
Sri Lanka
3408
4938
7143
9138
7449
7140
8775
Austria
344040
413412
365253
375531
479706
595911
688947
Brazil
175320
207171
194904
204324
240972
288744
330330
Portugal
34620
43347
45087
49590
60528
76875
94875
The third highest average annual expenditure growth on the vaccination program for children over the entire period (2015-2021) has been experienced by
Directions for questions: Answer the questions on the basis of the information given below.
The table given below shows the annual expenditure (in crores) spend by 5 different countries on their vaccination program for children.
|
(in crores) Countries |
2015 |
2016 |
2017 |
2018 |
2019 |
2020 |
2021 |
|
Nigeria |
3387 |
4167 |
4500 |
5769 |
6354 |
8394 |
9300 |
|
UK |
584793 |
747609 |
798294 |
976788 |
1314684 |
1779978 |
2285862 |
|
Egypt |
107001 |
127137 |
130083 |
147750 |
171255 |
226686 |
285288 |
|
France |
1252830 |
1437747 |
1210488 |
1250178 |
1415451 |
1697025 |
1784715 |
|
Italy |
431085 |
344534 |
451317 |
487413 |
581451 |
761535 |
853257 |
|
Sri Lanka |
3408 |
4938 |
7143 |
9138 |
7449 |
7140 |
8775 |
|
Austria |
344040 |
413412 |
365253 |
375531 |
479706 |
595911 |
688947 |
|
Brazil |
175320 |
207171 |
194904 |
204324 |
240972 |
288744 |
330330 |
|
Portugal |
34620 |
43347 |
45087 |
49590 |
60528 |
76875 |
94875 |
The third highest average annual expenditure growth on the vaccination program for children over the entire period (2015-2021) has been experienced by
Average annual growth
Nigeria
UK
Egypt
Portugal
Portugal experienced third the highest growth.
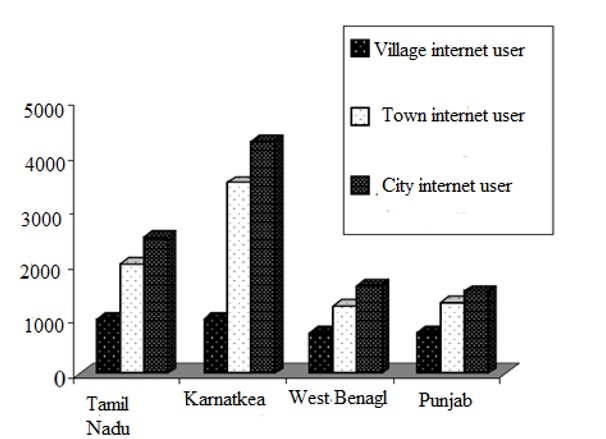
Upvote The following bar chart gives the increase in internet user percentage of villages, towns and cities in the four states for the period between 2018-19 and 2020-21. The table provides information about the number of households who uses internet, average expenditure by a household and growth on expenditure on internet by a household.
<!--[endif]-->
Number of households in 1987-88 (in thousands)
Average expenditure by house hold in internet on 2018-19
Growth in average household expenditure on internet (2018-19 over 2019-20)
Village
400
Rs. 30,00
50%
Town
100
Rs. 50,00
60%
City
50
Rs. 75,00
90%
The average income for the Tamil Nadu in 2020-21 was
The following bar chart gives the increase in internet user percentage of villages, towns and cities in the four states for the period between 2018-19 and 2020-21. The table provides information about the number of households who uses internet, average expenditure by a household and growth on expenditure on internet by a household.
<!--[endif]-->
|
|
Number of households in 1987-88 (in thousands) |
Average expenditure by house hold in internet on 2018-19 |
Growth in average household expenditure on internet (2018-19 over 2019-20) |
|
Village |
400 |
Rs. 30,00 |
50% |
|
Town |
100 |
Rs. 50,00 |
60% |
|
City |
50 |
Rs. 75,00 |
90% |
The average income for the Tamil Nadu in 2020-21 was
Average expenditure on internet for the Tamil Nadu
= = 37727.
Upvote