
DILR Preparation Tips for MBA
Get insights from 171 questions on DILR Preparation Tips for MBA, answered by students, alumni, and experts. You may also ask and answer any question you like about DILR Preparation Tips for MBA
- 171
Questions
- 0
Discussions
- 0
Active Users
- 1
Followers
Have a question about DILR Preparation Tips for MBA? Ask our experts
Keep it short & simple. Type complete word. Avoid abusive language.
Direction for questions: Answer the questions on the basis of the information given below.
The table given below shows a few details about the temperature distribution of Kashi cities (Ajmer, Ayodha, Mathura and Kashi). For any given month, the average temperature in each of the four cities can be expressed as a (Min) + b (Max), where a and b are constants and are the same for all the cities in that month but different in different months, and Min and Max are the minimum and maximum temperatures respectively for that month in that city.
July
Aug
Sept
Oct
Nov
Dec
Cities
Max
Min
Avg
Max
Min
Avg
Max
Min
Avg
Max
Min
Avg
Max
Min
Avg
Max
Min
Avg
Ajmer
12.0
4.0
5.6
14.0
7.0
11.2
-
10.0
14.5
-
10.0
17.5
29.0
-
23.9
31.0
14.0
-
Ayodha
6.0
-
2.0
8.0
3.0
6.0
10.0
5.0
7.5
-
9.0
11.5
16.0
11.0
14.5
19.0
-
17.5
Mathura
20.0
12.0
-
13.0
19.6
29.0
17.0
23.0
36.0
21.0
28.5
38.0
24.0
-
41.0
27.0
36.8
Kashi
13.0
7.0
8.2
16.0
10.0
-
19.0
-
16.5
21.0
16.0
18.5
24.0
18.0
22.2
26.0
21.0
24.5
What is the average temperature of city Mathura in May?
Direction for questions: Answer the questions on the basis of the information given below.
The table given below shows a few details about the temperature distribution of Kashi cities (Ajmer, Ayodha, Mathura and Kashi). For any given month, the average temperature in each of the four cities can be expressed as a (Min) + b (Max), where a and b are constants and are the same for all the cities in that month but different in different months, and Min and Max are the minimum and maximum temperatures respectively for that month in that city.
|
|
|
July |
|
|
Aug |
|
|
Sept |
|
|
Oct |
|
|
Nov |
|
|
Dec |
|
|
Cities |
Max |
Min |
Avg |
Max |
Min |
Avg |
Max |
Min |
Avg |
Max |
Min |
Avg |
Max |
Min |
Avg |
Max |
Min |
Avg |
|
Ajmer |
12.0 |
4.0 |
5.6 |
14.0 |
7.0 |
11.2 |
- |
10.0 |
14.5 |
- |
10.0 |
17.5 |
29.0 |
- |
23.9 |
31.0 |
14.0 |
- |
|
Ayodha |
6.0 |
- |
2.0 |
8.0 |
3.0 |
6.0 |
10.0 |
5.0 |
7.5 |
- |
9.0 |
11.5 |
16.0 |
11.0 |
14.5 |
19.0 |
- |
17.5 |
|
Mathura |
20.0 |
12.0 |
- |
|
13.0 |
19.6 |
29.0 |
17.0 |
23.0 |
36.0 |
21.0 |
28.5 |
38.0 |
24.0 |
- |
41.0 |
27.0 |
36.8 |
|
Kashi |
13.0 |
7.0 |
8.2 |
16.0 |
10.0 |
- |
19.0 |
- |
16.5 |
21.0 |
16.0 |
18.5 |
24.0 |
18.0 |
22.2 |
26.0 |
21.0 |
24.5 |
What is the average temperature of city Mathura in May?
|
| July |
|
| Aug |
|
| Sep |
|
| Oct |
|
| Nov |
|
| Dec |
|
Cities | Max | Min | Avg | Max | Min | Avg | Max | Min | Avg | Max | Min | Avg | Max | Min | Avg | Max | Min | Avg |
Ajmer | 12.0 | 4.0 | 5.6 | 14.0 | 7.0 | 11.2 | 19.0 | 10.0 | 14.5 | 25.0 | 10.0 | 17.5 | 29.0 | 12.0 | 23.9 | 31.0 | 14.0 | 25.9 |
Ayodhya | 6.0 | 1.0 | 2.0 | 8.0 | 3.0 | 6.0 | 10.0 | 5.0 | 7.5 | 14.0 | 9.0 | 11.5 | 16.0 | 11.0 | 14.5 | 19.0 | 14.0 | 17.5 |
Mathura | 20.0 | 12.0 | 13.6 | 24.0 | 13.0 | 19.6 | 29.0 | 17.0 | 23.0 | 36.0 | 21.0 | 28.5 | 38.0 | 24.0 | 33.8 | 41.0 | 27.0 | 36.8 |
Kashi | 13.0 | 7.0 | 8.2 | 16.0 | 10.0 | 13.6 | 19.0 | 14.0 | 16.5 | 21.0 | 16.0 | 18.5 | 24.0 | 18.0 | 22.2 | 26.0 | 21.0 | 24.5 |
 Upvote

Directions for questions: Answer the questions on the basis of the information given below. Given below is a network of oil pipelines and nine hubs– A through I. The requirement of oil at the hubs is exactly met by the flow in the pipelines. The flow in some of the pipelines and the requirement at some of the hubs is also mentioned. A is the only hub which is a source hub, i.e. the hub A does not have any requirement of its own but it supplies the requirement of all the other hubs.
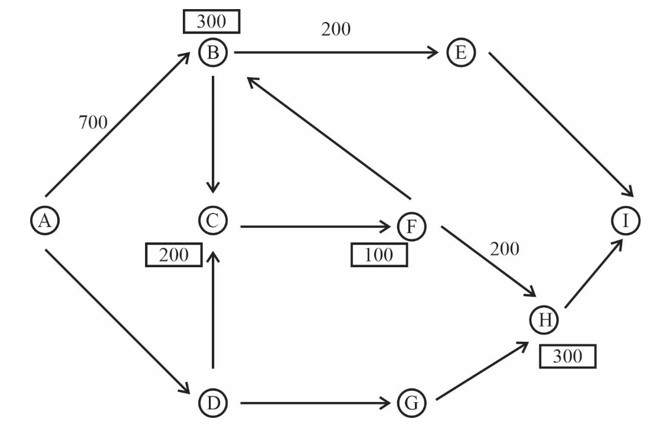
It is also known that
I. The maximum capacity of any pipeline is 1000.
II. The requirement at any hub except A and I is equal to the flow in exactly one of the pipelines directly connected to it.
III. No two pipelines directly connected to the same hub carry the same amount of oil.
IV. The flow in none of the pipelines shown above is zero.
What is the required at the junction I?
Directions for questions: Answer the questions on the basis of the information given below. Given below is a network of oil pipelines and nine hubs– A through I. The requirement of oil at the hubs is exactly met by the flow in the pipelines. The flow in some of the pipelines and the requirement at some of the hubs is also mentioned. A is the only hub which is a source hub, i.e. the hub A does not have any requirement of its own but it supplies the requirement of all the other hubs.
It is also known that
I. The maximum capacity of any pipeline is 1000.
II. The requirement at any hub except A and I is equal to the flow in exactly one of the pipelines directly connected to it.
III. No two pipelines directly connected to the same hub carry the same amount of oil.
IV. The flow in none of the pipelines shown above is zero.
What is the required at the junction I?
As not two pipelines connecting same place are carrying same amount, and at least one of the pipelines should carry same as that of the place, either H-I or G-H must carry 300. If G-H carries 300, then H-I must carry 200, which is not possible.
H-I must carry 300 and G-H must carry 400. D-G should ca
Upvote Directions for questions: Read the following passage and solve the questions based on it.
(i) Mr Sharma has five sons – A, K, S, R, and N. While going for a party, they wore different coloured shirts viz., red, yellow blue, white and green (not necessarily in the same order).
(ii) Each one of them has different likings viz., reading, playing traveling, singing and writing in no particular order.
(iii) K, who has a liking for singing, does not wear a yellow shirt. S wears red shit and does not like reading or writing. N likes to play and does not wear a blue or yellow shirt. A has a liking for writing and R does not wear a yellow or green shirt.
What is the colour of K’s shirt?
Directions for questions: Read the following passage and solve the questions based on it.
(i) Mr Sharma has five sons – A, K, S, R, and N. While going for a party, they wore different coloured shirts viz., red, yellow blue, white and green (not necessarily in the same order).
(ii) Each one of them has different likings viz., reading, playing traveling, singing and writing in no particular order.
(iii) K, who has a liking for singing, does not wear a yellow shirt. S wears red shit and does not like reading or writing. N likes to play and does not wear a blue or yellow shirt. A has a liking for writing and R does not wear a yellow or green shirt.
What is the colour of K’s shirt?
Son | Color of shirt | Likes |
A | yellow | writing |
K | white/blue/green | singing |
S | red | traveling |
R | blue/white | reading |
N | green/white | playing |
Upvote The following charts show the responses of the population of the state of ABC over a four-year period to the question– “Is State ownership the best way to run an enterprise OR an enterprise is best run by private entrepreneurs?” The eligible voting population of ABC was 4.8 million in January 2003 and can be assumed to have grown by 20% each year during the period January 2002–January 2005. The entire eligible population voted in each of the four years and every person casted a vote in favour of only one of the five options shown each year.
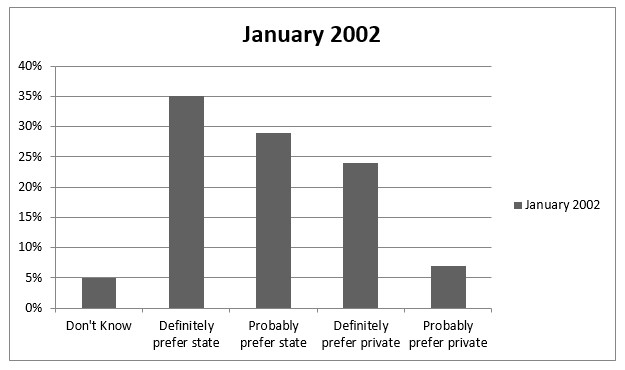
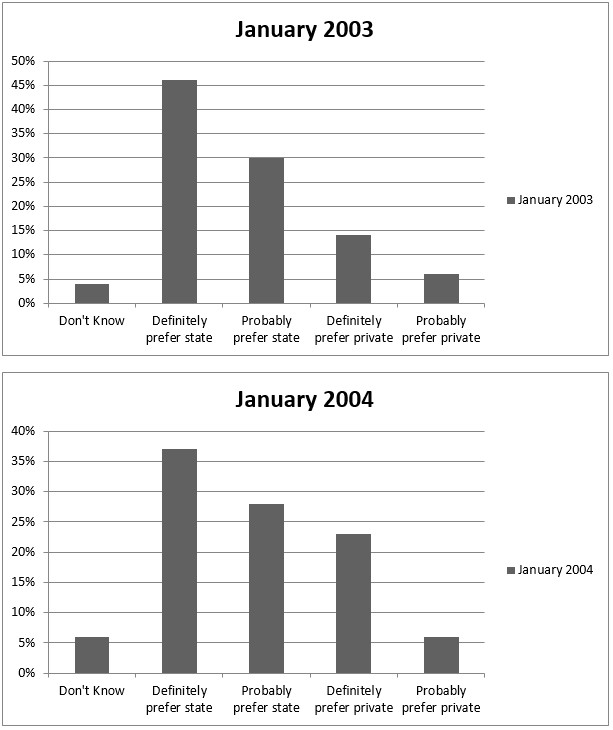
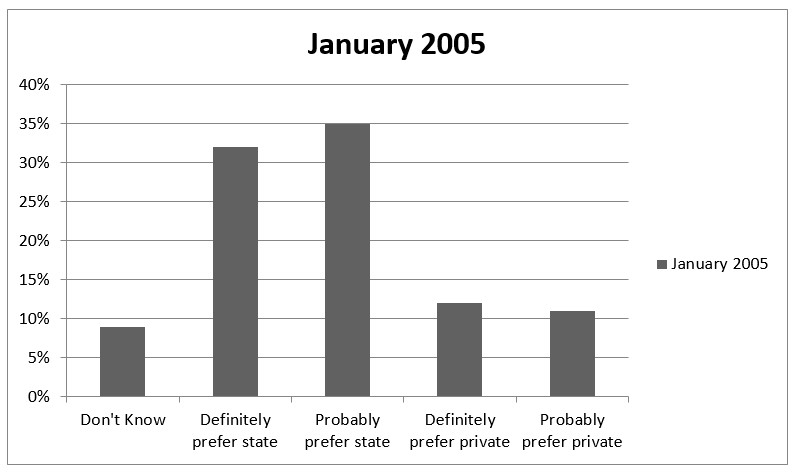
For how many options during the give period did the number of people voting in favour of the options, decrease in each year, relative to the previous year.
The following charts show the responses of the population of the state of ABC over a four-year period to the question– “Is State ownership the best way to run an enterprise OR an enterprise is best run by private entrepreneurs?” The eligible voting population of ABC was 4.8 million in January 2003 and can be assumed to have grown by 20% each year during the period January 2002–January 2005. The entire eligible population voted in each of the four years and every person casted a vote in favour of only one of the five options shown each year.
For how many options during the give period did the number of people voting in favour of the options, decrease in each year, relative to the previous year.
Using the reverse of the above condition you can see that the actual percentage voting for each one of the options increased in at least one of the years, Hence, none of the options saw a continuous decrease over the period.
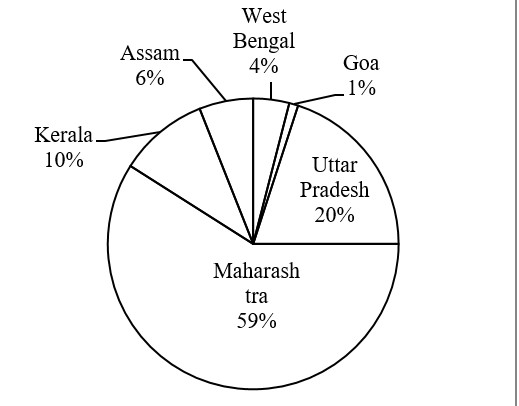
Upvote The pie chart given below show the crops exporting states of India in 2017-18 and the bar graph shows the 5 types of crop exported by Madhya Pradesh (in lakhs)from 2017-18 to 2019-20 .
To Exporting states of India of crops in 2017-18
Export of crops from Madhya Pradesh
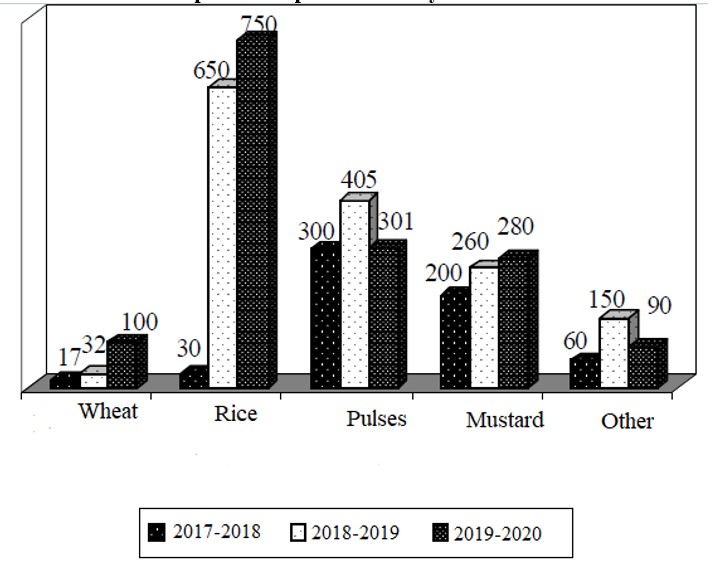
If crops from Madhya Pradesh constituted 10% of India trade in 2017-18, then the export of Maharashtra in the nation crops trade in 2017-18 ?
The pie chart given below show the crops exporting states of India in 2017-18 and the bar graph shows the 5 types of crop exported by Madhya Pradesh (in lakhs)from 2017-18 to 2019-20 .
To Exporting states of India of crops in 2017-18
Export of crops from Madhya Pradesh
If crops from Madhya Pradesh constituted 10% of India trade in 2017-18, then the export of Maharashtra in the nation crops trade in 2017-18 ?
The pie chart given below show the crops exporting states of India in 2017-18 and the bar graph shows the 5 types of crop exported by Madhya Pradesh (in lakhs)from 2017-18 to 2019-20 .
To Exporting states of India of crops in 2017-18
Export of crops from Madhya Pradesh
What is the India’s crops export in 2017- 18, if Madhya Pradesh’s exports constitute 20% of others category ?
The pie chart given below show the crops exporting states of India in 2017-18 and the bar graph shows the 5 types of crop exported by Madhya Pradesh (in lakhs)from 2017-18 to 2019-20 .
To Exporting states of India of crops in 2017-18
Export of crops from Madhya Pradesh
What is the India’s crops export in 2017- 18, if Madhya Pradesh’s exports constitute 20% of others category ?
4% of India's crops in 2017-18 = 3625,
India's export = 3625 * 25 = 90625
Upvote Directions: Study the following diagrams and answer the questions based on them .
The pie chart given below show the crops exporting states of India in 2017-18 and the bar graph shows the 5 types of crop exported by Madhya Pradesh (in lakhs)from 2017-18 to 2019-20 .
To Exporting states of India of crops in 2017-18
Export of crops from Madhya Pradesh
Directions: Study the following diagrams and answer the questions based on them .
The pie chart given below show the crops exporting states of India in 2017-18 and the bar graph shows the 5 types of crop exported by Madhya Pradesh (in lakhs)from 2017-18 to 2019-20 .
To Exporting states of India of crops in 2017-18
Export of crops from Madhya Pradesh
Crops exports in 2017-18
= Rs. (17+30+300+200+60)lacs
= Rs. 607 lacs
Crops export in 2019-20
= Rs. (100 + 750 + 301 + 280 + 90)
= Rs. 1521 lacs
% growth
Upvote The line graph given below shows the number of dishes ordered in a restaurant chain in seven month
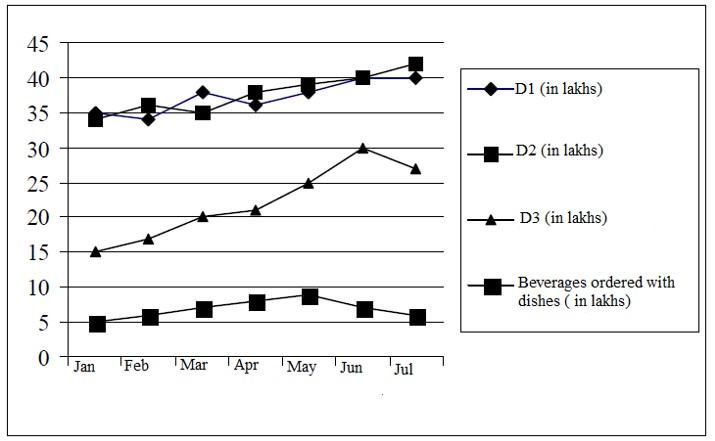
If the cost of beverage is Rs. 320 & D3 dish is 160, in which month the profit made on selling beverages with D3 dishes is maximun?
The line graph given below shows the number of dishes ordered in a restaurant chain in seven month
If the cost of beverage is Rs. 320 & D3 dish is 160, in which month the profit made on selling beverages with D3 dishes is maximun?
Profit made on June
= (320 * 0.093) + (160 * 0.37) = Rs. 88.96 lakhss
which is the highest.
Upvote The line graph given below shows the number of dishes ordered in a restaurant chain in seven month
In which month was the difference between the percentage change in order of D3 dishes is maximum than the previous month?
The line graph given below shows the number of dishes ordered in a restaurant chain in seven month
In which month was the difference between the percentage change in order of D3 dishes is maximum than the previous month?
Clearly for the line graph, the change is maximum in June
Upvote Directions: Answer the questions based on the following Graph.
The line graph given below shows the number of dishes ordered in a restaurant chain in seven month
In which month, the order of beverages with respect to the sum of order of D1 and D2 is least.
Directions: Answer the questions based on the following Graph.
The line graph given below shows the number of dishes ordered in a restaurant chain in seven month
In which month, the order of beverages with respect to the sum of order of D1 and D2 is least.
The difference between the sum of D1 and D2 dishes is maximum in the month of July. So, with respect to the sum of D1 and D2 dishes least beverages order in month of July.
Upvote