
DILR Preparation Tips for MBA
Get insights from 171 questions on DILR Preparation Tips for MBA, answered by students, alumni, and experts. You may also ask and answer any question you like about DILR Preparation Tips for MBA
- 171
Questions
- 0
Discussions
- 0
Active Users
- 1
Followers
Have a question about DILR Preparation Tips for MBA? Ask our experts
Keep it short & simple. Type complete word. Avoid abusive language.
The bar graph given below shows the profit earned by 5 PSU’s from 2017 to 2021<!--[endif]-->
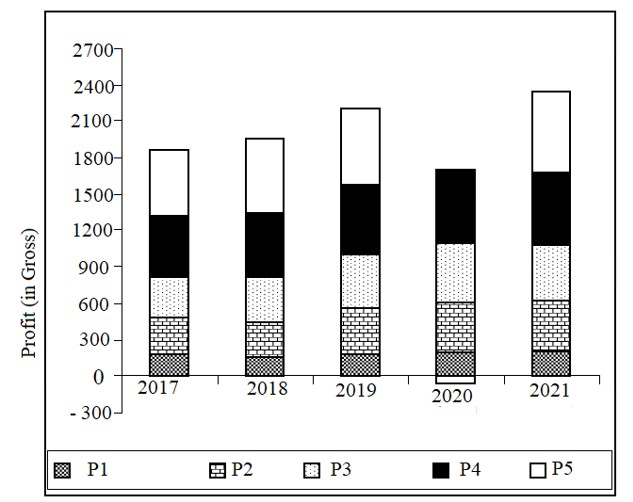
In which year the profit of P3 is the maximum?
The bar graph given below shows the profit earned by 5 PSU’s from 2017 to 2021<!--[endif]-->
In which year the profit of P3 is the maximum?
Clearly from the bar graph, P3 are maximum in the year 2020.
 Upvote

The bar graph given below shows the profit earned by 5 PSU’s from 2017 to 2021<!--[endif]-->
In how many years the P5 profit has not decreased in comparison to the previous year?
The bar graph given below shows the profit earned by 5 PSU’s from 2017 to 2021<!--[endif]-->
In how many years the P5 profit has not decreased in comparison to the previous year?
In 2018, 2019 and 2021 the P5 has not decreased in comparison to the previous year
Upvote The bar graph given below shows the profit earned by 5 PSU’s from 2017 to 2021<!--[endif]-->
In which period was the change in P5 profit is maximum?
The bar graph given below shows the profit earned by 5 PSU’s from 2017 to 2021<!--[endif]-->
In which period was the change in P5 profit is maximum?
Decrease in P5 in the year 2019-2020 is maximum.
Upvote Directions: Answer the questions based on the following Graph.
The bar graph given below shows the profit earned by 5 PSU’s from 2017 to 2021<!--[endif]-->
In which year was the increase in P1 profit is maximum?
Directions: Answer the questions based on the following Graph.
The bar graph given below shows the profit earned by 5 PSU’s from 2017 to 2021<!--[endif]-->
In which year was the increase in P1 profit is maximum?
From the graph, it is clear that increase in P1 profit or less is maximum in 2019
Upvote The line graph given below shows the marked price, selling price and cost of manufacturing of an aircraft (in crore).
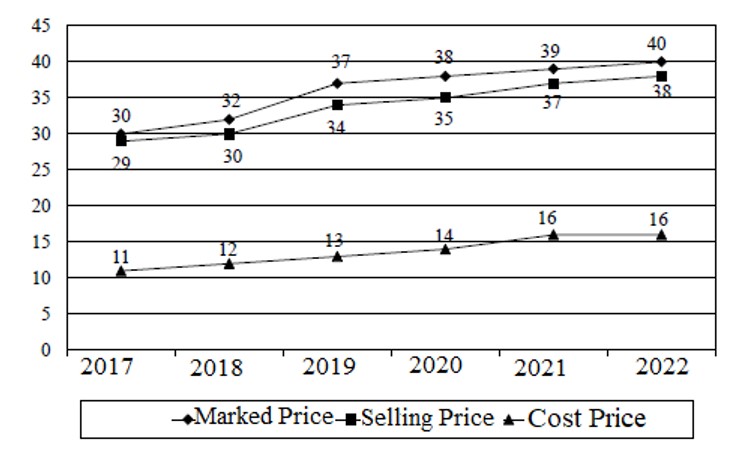
The line graph given below shows the marked price, selling price and cost of manufacturing of an aircraft (in crore).
the highest profit if commercial aircrafts sold on Marked Price in the year 2020
= 38 – 14 = 24 crores
Upvote The line graph given below shows the marked price, selling price and cost of manufacturing of an aircraft (in crore).
In which year is the total increase in the selling price highest as compared to last year’s selling price ?
The line graph given below shows the marked price, selling price and cost of manufacturing of an aircraft (in crore).
In which year is the total increase in the selling price highest as compared to last year’s selling price ?
Total increase in selling price is the highest as compared to last year ago
(2019 – 2018) = (34 – 30) = 4crores
Upvote Directions: Answer the questions based on the following Graph.
The line graph given below shows the marked price, selling price and cost of manufacturing of an aircraft (in crore).
Directions: Answer the questions based on the following Graph.
The line graph given below shows the marked price, selling price and cost of manufacturing of an aircraft (in crore).
Profit is given by ()
Maximum profit in 2020 (38 - 16) = 22 crores
Upvote Directions for questions: Answer the following questions based on the information given below.<!--[endif]-->
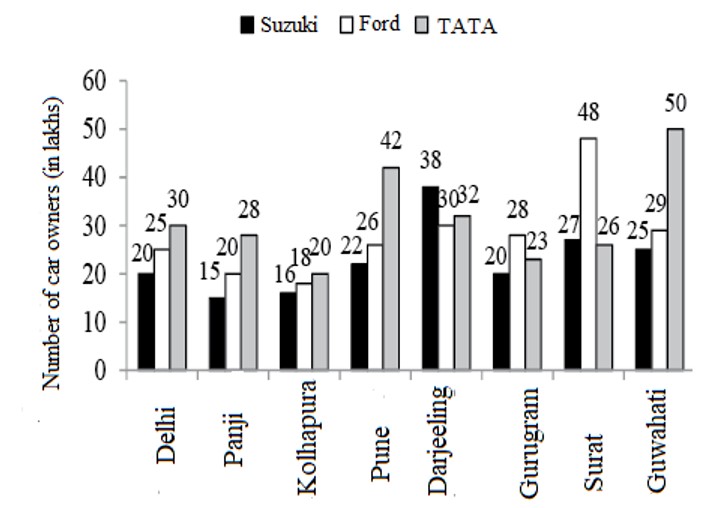
The above graph shows the number of cars owners of three different company in eight different states of India.
If SUZUKI, FORD and TATA have each decided to facilitate service centre in those cities where its cars owners are highest in number, which of the following cities will avail themselves of this facility?
Directions for questions: Answer the following questions based on the information given below.<!--[endif]-->
The above graph shows the number of cars owners of three different company in eight different states of India.
If SUZUKI, FORD and TATA have each decided to facilitate service centre in those cities where its cars owners are highest in number, which of the following cities will avail themselves of this facility?
Directions for questions: Answer the following questions based on the information given below.<!--[endif]-->
The above graph shows the number of cars owners of three different company in eight different states of India.
By what percent the number of TATA cars owner in Surat is less than that of Suzuki in Darjeeling ?
Directions for questions: Answer the following questions based on the information given below.<!--[endif]-->
The above graph shows the number of cars owners of three different company in eight different states of India.
By what percent the number of TATA cars owner in Surat is less than that of Suzuki in Darjeeling ?
Number of TATA car owner in Surat = 26
Number of Suzuki cars owner in Darjeeling = 38
Acc. to question
= = 31.57 lakhs
Upvote