
DILR Preparation Tips for MBA
Get insights from 171 questions on DILR Preparation Tips for MBA, answered by students, alumni, and experts. You may also ask and answer any question you like about DILR Preparation Tips for MBA
- 171
Questions
- 0
Discussions
- 0
Active Users
- 1
Followers
Have a question about DILR Preparation Tips for MBA? Ask our experts
Keep it short & simple. Type complete word. Avoid abusive language.
The following table shows the highest and the average marks obtained by students in subjects over the year. The maximum mark in each subject is 100.
SUBJECTS
Botany
Economics
Physics
Chemistry
Zoology
High
Average
High
Average
High
Average
High
Average
High
Average
2001
85
62
75
52
98
65
88
72
72
46
2002
80
70
80
53
94
60
89
70
70
55
2003
82
65
77
54
85
62
95
64
64
58
2004
71
56
84
65
92
68
97
68
68
49
2005
75
52
82
66
91
64
92
75
75
58
2006
82
66
81
57
89
66
98
72
72
62
The average highest marks in English in 2001, 2002 and 2005 were exactly equal to the highest marks in Hindi in which of the following years?
The following table shows the highest and the average marks obtained by students in subjects over the year. The maximum mark in each subject is 100.
|
SUBJECTS |
||||||||||
|
|
Botany |
Economics |
Physics |
Chemistry |
Zoology |
|||||
|
High |
Average |
High |
Average |
High |
Average |
High |
Average |
High |
Average |
|
|
2001 |
85 |
62 |
75 |
52 |
98 |
65 |
88 |
72 |
72 |
46 |
|
2002 |
80 |
70 |
80 |
53 |
94 |
60 |
89 |
70 |
70 |
55 |
|
2003 |
82 |
65 |
77 |
54 |
85 |
62 |
95 |
64 |
64 |
58 |
|
2004 |
71 |
56 |
84 |
65 |
92 |
68 |
97 |
68 |
68 |
49 |
|
2005 |
75 |
52 |
82 |
66 |
91 |
64 |
92 |
75 |
75 |
58 |
|
2006 |
82 |
66 |
81 |
57 |
89 |
66 |
98 |
72 |
72 |
62 |
The average highest marks in English in 2001, 2002 and 2005 were exactly equal to the highest marks in Hindi in which of the following years?
Average the highest marks
Therefore, the correct answer is option (d)
 Upvote

The following table shows the highest and the average marks obtained by students in subjects over the year. The maximum mark in each subject is 100.
SUBJECTS
Botany
Economics
Physics
Chemistry
Zoology
High
Average
High
Average
High
Average
High
Average
High
Average
2001
85
62
75
52
98
65
88
72
72
46
2002
80
70
80
53
94
60
89
70
70
55
2003
82
65
77
54
85
62
95
64
64
58
2004
71
56
84
65
92
68
97
68
68
49
2005
75
52
82
66
91
64
92
75
75
58
2006
82
66
81
57
89
66
98
72
72
62
What was the approximate percentage increase in average marks in History from 2001 and 2002?
The following table shows the highest and the average marks obtained by students in subjects over the year. The maximum mark in each subject is 100.
|
SUBJECTS |
||||||||||
|
|
Botany |
Economics |
Physics |
Chemistry |
Zoology |
|||||
|
High |
Average |
High |
Average |
High |
Average |
High |
Average |
High |
Average |
|
|
2001 |
85 |
62 |
75 |
52 |
98 |
65 |
88 |
72 |
72 |
46 |
|
2002 |
80 |
70 |
80 |
53 |
94 |
60 |
89 |
70 |
70 |
55 |
|
2003 |
82 |
65 |
77 |
54 |
85 |
62 |
95 |
64 |
64 |
58 |
|
2004 |
71 |
56 |
84 |
65 |
92 |
68 |
97 |
68 |
68 |
49 |
|
2005 |
75 |
52 |
82 |
66 |
91 |
64 |
92 |
75 |
75 |
58 |
|
2006 |
82 |
66 |
81 |
57 |
89 |
66 |
98 |
72 |
72 |
62 |
What was the approximate percentage increase in average marks in History from 2001 and 2002?
The following table shows the highest and the average marks obtained by students in subjects over the year. The maximum mark in each subject is 100.
SUBJECTS
Botany
Economics
Physics
Chemistry
Zoology
High
Average
High
Average
High
Average
High
Average
High
Average
2001
85
62
75
52
98
65
88
72
72
46
2002
80
70
80
53
94
60
89
70
70
55
2003
82
65
77
54
85
62
95
64
64
58
2004
71
56
84
65
92
68
97
68
68
49
2005
75
52
82
66
91
64
92
75
75
58
2006
82
66
81
57
89
66
98
72
72
62
The difference in the average marks in History between 2003 and 2004 was exactly equal to the difference in the highest marks in Hindi between which of the following pair of years?
The following table shows the highest and the average marks obtained by students in subjects over the year. The maximum mark in each subject is 100.
|
SUBJECTS |
||||||||||
|
|
Botany |
Economics |
Physics |
Chemistry |
Zoology |
|||||
|
High |
Average |
High |
Average |
High |
Average |
High |
Average |
High |
Average |
|
|
2001 |
85 |
62 |
75 |
52 |
98 |
65 |
88 |
72 |
72 |
46 |
|
2002 |
80 |
70 |
80 |
53 |
94 |
60 |
89 |
70 |
70 |
55 |
|
2003 |
82 |
65 |
77 |
54 |
85 |
62 |
95 |
64 |
64 |
58 |
|
2004 |
71 |
56 |
84 |
65 |
92 |
68 |
97 |
68 |
68 |
49 |
|
2005 |
75 |
52 |
82 |
66 |
91 |
64 |
92 |
75 |
75 |
58 |
|
2006 |
82 |
66 |
81 |
57 |
89 |
66 |
98 |
72 |
72 |
62 |
The difference in the average marks in History between 2003 and 2004 was exactly equal to the difference in the highest marks in Hindi between which of the following pair of years?
The difference is 9. Therefore the correct answer is option (a)
Upvote Direction for question: Rea refer to the following table and solve the questions based on it.
The following table shows the highest and the average marks obtained by students in subjects over the year. The maximum mark in each subject is 100.
SUBJECTS
Botany
Economics
Physics
Chemistry
Zoology
High
Average
High
Average
High
Average
High
Average
High
Average
2001
85
62
75
52
98
65
88
72
72
46
2002
80
70
80
53
94
60
89
70
70
55
2003
82
65
77
54
85
62
95
64
64
58
2004
71
56
84
65
92
68
97
68
68
49
2005
75
52
82
66
91
64
92
75
75
58
2006
82
66
81
57
89
66
98
72
72
62
What were the grand average marks of the five subjects in 2005?
Direction for question: Rea refer to the following table and solve the questions based on it.
The following table shows the highest and the average marks obtained by students in subjects over the year. The maximum mark in each subject is 100.
|
SUBJECTS |
||||||||||
|
|
Botany |
Economics |
Physics |
Chemistry |
Zoology |
|||||
|
High |
Average |
High |
Average |
High |
Average |
High |
Average |
High |
Average |
|
|
2001 |
85 |
62 |
75 |
52 |
98 |
65 |
88 |
72 |
72 |
46 |
|
2002 |
80 |
70 |
80 |
53 |
94 |
60 |
89 |
70 |
70 |
55 |
|
2003 |
82 |
65 |
77 |
54 |
85 |
62 |
95 |
64 |
64 |
58 |
|
2004 |
71 |
56 |
84 |
65 |
92 |
68 |
97 |
68 |
68 |
49 |
|
2005 |
75 |
52 |
82 |
66 |
91 |
64 |
92 |
75 |
75 |
58 |
|
2006 |
82 |
66 |
81 |
57 |
89 |
66 |
98 |
72 |
72 |
62 |
What were the grand average marks of the five subjects in 2005?
The XYZ manufacturing company produces a product which has 6 month demand cycle as given below:
Month
Demand in Units
Working days/month
January
600
22
February
1000
19
March
800
21
April
200
21
May
400
22
June
600
2
Company’s policy is to retain safety stock of 20% of monthly demand and each month’s safety stock becomes the opening stock for the next month, and opening stock for January is 100 units. Each unit requires 10 labour-hours and company works 8 hour/day.
If there are currently 20 workers employed, and how many worker are needed to be laid off in January to accommodate demand?
The XYZ manufacturing company produces a product which has 6 month demand cycle as given below:
|
Month |
Demand in Units |
Working days/month |
|
January |
600 |
22 |
|
February |
1000 |
19 |
|
March |
800 |
21 |
|
April |
200 |
21 |
|
May |
400 |
22 |
|
June |
600 |
2 |
Company’s policy is to retain safety stock of 20% of monthly demand and each month’s safety stock becomes the opening stock for the next month, and opening stock for January is 100 units. Each unit requires 10 labour-hours and company works 8 hour/day.
If there are currently 20 workers employed, and how many worker are needed to be laid off in January to accommodate demand?
The XYZ manufacturing company produces a product which has 6 month demand cycle as given below:
Month
Demand in Units
Working days/month
January
600
22
February
1000
19
March
800
21
April
200
21
May
400
22
June
600
2
Company’s policy is to retain safety stock of 20% of monthly demand and each month’s safety stock becomes the opening stock for the next month, and opening stock for January is 100 units. Each unit requires 10 labour-hours and company works 8 hour/day.
In which month production requirement is highest?
The XYZ manufacturing company produces a product which has 6 month demand cycle as given below:
|
Month |
Demand in Units |
Working days/month |
|
January |
600 |
22 |
|
February |
1000 |
19 |
|
March |
800 |
21 |
|
April |
200 |
21 |
|
May |
400 |
22 |
|
June |
600 |
2 |
Company’s policy is to retain safety stock of 20% of monthly demand and each month’s safety stock becomes the opening stock for the next month, and opening stock for January is 100 units. Each unit requires 10 labour-hours and company works 8 hour/day.
In which month production requirement is highest?
Direction for question: Go through the table given below and solve the questions based on it.
The XYZ manufacturing company produces a product which has 6 month demand cycle as given below:
Month
Demand in Units
Working days/month
January
600
22
February
1000
19
March
800
21
April
200
21
May
400
22
June
600
2
Company’s policy is to retain safety stock of 20% of monthly demand and each month’s safety stock becomes the opening stock for the next month, and opening stock for January is 100 units. Each unit requires 10 labour-hours and company works 8 hour/day.
What is the opening stock for June?
Direction for question: Go through the table given below and solve the questions based on it.
The XYZ manufacturing company produces a product which has 6 month demand cycle as given below:
|
Month |
Demand in Units |
Working days/month |
|
January |
600 |
22 |
|
February |
1000 |
19 |
|
March |
800 |
21 |
|
April |
200 |
21 |
|
May |
400 |
22 |
|
June |
600 |
2 |
Company’s policy is to retain safety stock of 20% of monthly demand and each month’s safety stock becomes the opening stock for the next month, and opening stock for January is 100 units. Each unit requires 10 labour-hours and company works 8 hour/day.
What is the opening stock for June?
Month | Opening | Demand | Resource 20% | Production | Working days |
January | 100 | 600 | 120 | 620 | 22 |
February | 120 | 1000 | 200 | 1080 | 19 |
March | 200 | 800 | 160 | 760 | 21 |
April | 160 | 200 | 40 | 80 | 21 |
May | 40 | 400 | 80 | 440 | 22 |
June | 80 | 600 | 120 | 640 | 20 |
Upvote Go through the bar charts below and solve the questions that follow.
There are only three cities – A, B and C, in a state.
Following bar chart gives us the population figures of these cities (Figure in’ 000):
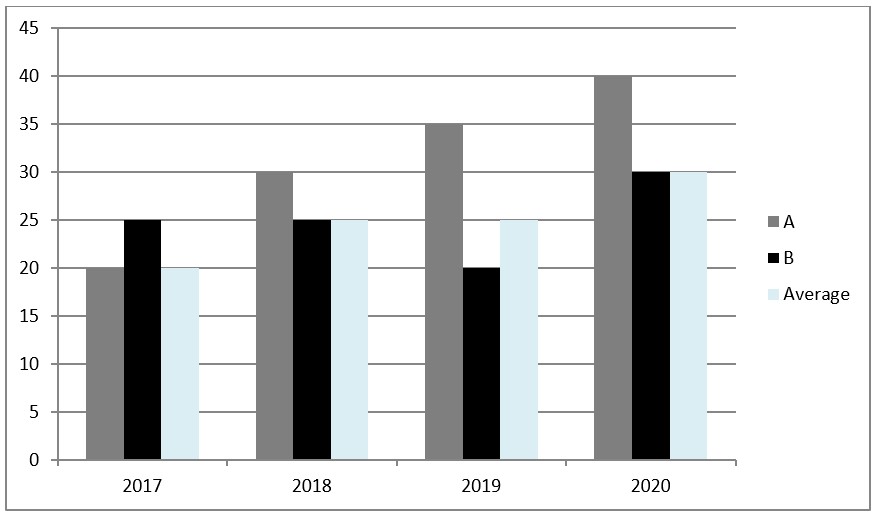
For which year is the ratio of population of city A to the population of city B the highest?
Go through the bar charts below and solve the questions that follow.
There are only three cities – A, B and C, in a state.
Following bar chart gives us the population figures of these cities (Figure in’ 000):
For which year is the ratio of population of city A to the population of city B the highest?
The rate of increase in expenses from year 3 to year 5 is 10%. So expenditure in year 6 = 22 * 1.1 = 24.2 crore
Upvote Go through the bar charts below and solve the questions that follow.
There are only three cities – A, B and C, in a state.
Following bar chart gives us the population figures of these cities (Figure in’ 000):
If increase in the population of city can only be due to new births and decrease in population of city can only due to death, then number of new births in city A in year 2020 is (in’ 000):
Go through the bar charts below and solve the questions that follow.
There are only three cities – A, B and C, in a state.
Following bar chart gives us the population figures of these cities (Figure in’ 000):
If increase in the population of city can only be due to new births and decrease in population of city can only due to death, then number of new births in city A in year 2020 is (in’ 000):
The difference between the expenditure in year 2 and year 1 is 2% Use the options now.
Upvote Related Tags
0 Followers
0 Followers
0 Followers
0 Followers
0 Followers
0 Followers
0 Followers
0 Followers
0 Followers
Go through the bar charts below and solve the questions that follow.
There are only three cities – A, B and C, in a state.
Following bar chart gives us the population figures of these cities (Figure in’ 000):
In which year was the population of city A the highest in state’s total population?
Go through the bar charts below and solve the questions that follow.
There are only three cities – A, B and C, in a state.
Following bar chart gives us the population figures of these cities (Figure in’ 000):
In which year was the population of city A the highest in state’s total population?