

DILR Preparation Tips for MBA
Get insights from 171 questions on DILR Preparation Tips for MBA, answered by students, alumni, and experts. You may also ask and answer any question you like about DILR Preparation Tips for MBA
Follow Ask QuestionQuestions
Discussions
Active Users
Followers
New answer posted
8 months ago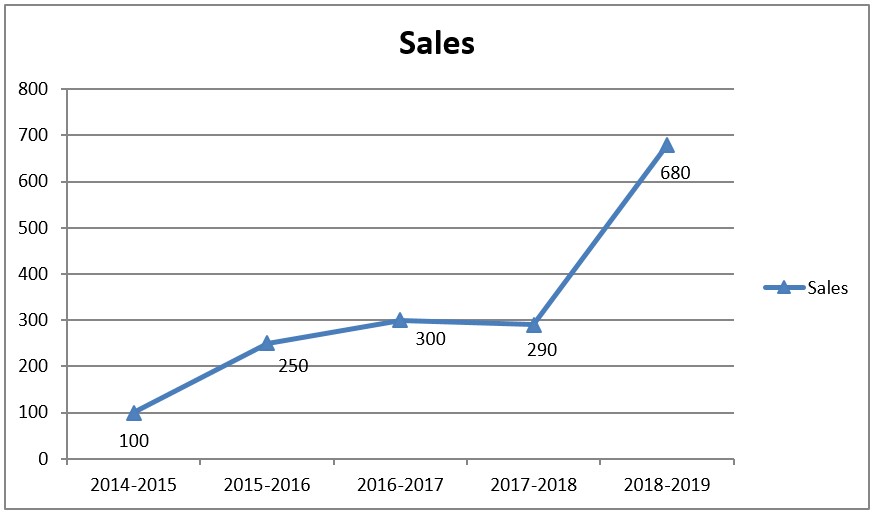
Contributor-Level 10
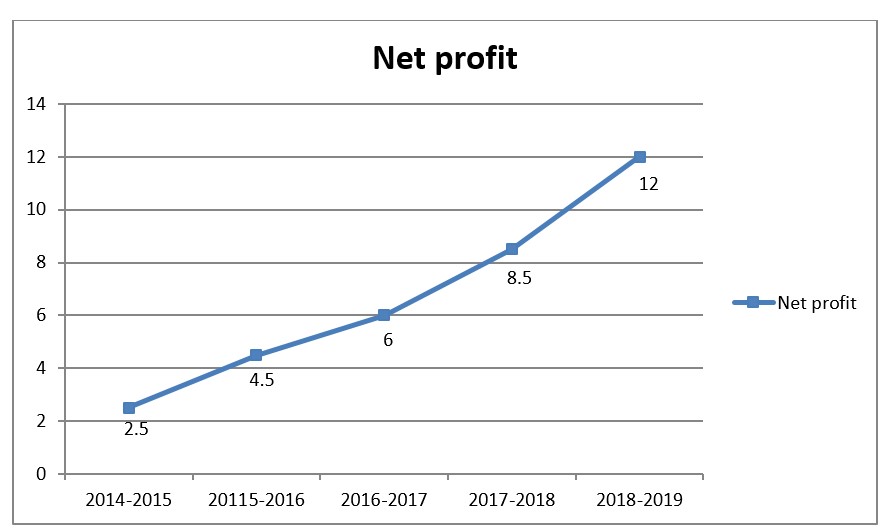
We can again calculate the growth in profits.
| Previous Profit | Current Profit | Difference | Percentage |
2015-16 | 2.5 | 4.5 | 2 | 80% |
2016-17 | 4.5 | 6 | 1.5 | 33.33% |
2017-18 | 6.0 | 8.5 | 2.5 | 41.66% |
2018-19 | 8.5 | 12 | 3.5 | 41.2% |
The highest percentage growth in net profit relative to the previous year was achieved in 2015-2016.
New answer posted
8 months agoContributor-Level 10
Using the graph, the percentage growth in sales are:
| Previous Profit | Current Profit | Difference | Percentage |
2015-16 | 100 | 250 | 150 | 150% |
2016-17 | 250 | 300 | 50 | 20% |
2017-18 | 300 | 290 | –10 | –3.33% |
2018-19 | 290 | 680 | 390 | 134.5% |
New answer posted
8 months agoNew answer posted
8 months agoContributor-Level 10
(1) Roll number 1 and 8 have MA, M.Com and BBA as common.
(2) Roll number 3 and 6 have MA, MSC, B.Com as common.
(3) Roll number 9 and 10 have all the four common options.
(4) Roll number 2 and 5 have MSC, M.Com and MBA as common.
New answer posted
8 months agoContributor-Level 10
(1) Roll number 3 and 6
(2) Roll number 1, 4 and 8
(3) Roll number 9, 10
(4) Roll number 7
New answer posted
8 months agoContributor-Level 10
In the first question, we derived the number of females in class secondary section as 288 and the total number of students in the section as 640.
New answer posted
8 months agoContributor-Level 10
Non-vegetarian Females in Class 12 = 0.25 * 32 = 8
Vegetarian Males in class 12 = 48 – 8 = 40
Non-vegetarian Males in class 12 = Non-vegetarian in class 12 – Female non-vegetarian in class 12
= 32 – 8 = 24
Required difference = 40 – 24 = 16
New answer posted
8 months agoContributor-Level 10
From the table given in the question,
Total student = 800
Students in Secondary = 0.8 * 800 = 640
Students in Class 11 = (800 – 640)/2 = 80
Student in Class 12 = 80
Females in Class 11 = 0.55 * 80 = 44
Females in Class 12 = 0.6 * 80 = 48
Females in Secondary = 0.475 * 800 – 44 – 48 = 288
Non-vegetarian in Class 11 = 0.5 * 80 = 40
Non-vegetarian in Secondary = 0.55 * 640 = 352
Non-vegetarian in Class 12 = 800 * 0.53 – 40 – 352 = 32
The percentage of non-vegetarian in class 12 = 32 * 100/80 = 40%
Taking an Exam? Selecting a College?
Get authentic answers from experts, students and alumni that you won't find anywhere else
Sign Up on ShikshaOn Shiksha, get access to
- 66k Colleges
- 1.2k Exams
- 687k Reviews
- 1800k Answers