
DILR Preparation Tips for MBA
Get insights from 171 questions on DILR Preparation Tips for MBA, answered by students, alumni, and experts. You may also ask and answer any question you like about DILR Preparation Tips for MBA
- 171
Questions
- 0
Discussions
- 0
Active Users
- 1
Followers
Have a question about DILR Preparation Tips for MBA? Ask our experts
Keep it short & simple. Type complete word. Avoid abusive language.
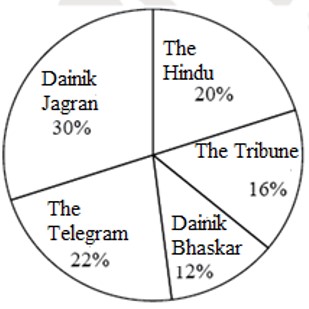
The pie chart given below shows the total number of people and the number of women who reads 5 different news paper.
Percentage of people who reads different newspaper in a town
Total number of people = 35,000
Percentage break-up of female who reads different newspaper in town
Total number of females = 15,000
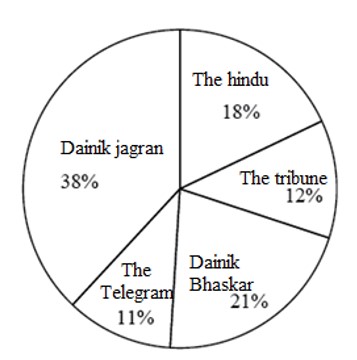
If 20% of the females who reads in the telegram change their liking to the tribune then what will be the new number of the tribune consumed by the people altogether?
The pie chart given below shows the total number of people and the number of women who reads 5 different news paper.
Percentage of people who reads different newspaper in a town
Total number of people = 35,000
Percentage break-up of female who reads different newspaper in town
Total number of females = 15,000
If 20% of the females who reads in the telegram change their liking to the tribune then what will be the new number of the tribune consumed by the people altogether?
The pie chart given below shows the total number of people and the number of women who reads 5 different news paper.
Percentage of people who reads different newspaper in a town
Total number of people = 35,000
Percentage break-up of female who reads different newspaper in town
Total number of females = 15,000
What is the total number of females who reads the telegram and dainik bhaskar together?
The pie chart given below shows the total number of people and the number of women who reads 5 different news paper.
Percentage of people who reads different newspaper in a town
Total number of people = 35,000
Percentage break-up of female who reads different newspaper in town
Total number of females = 15,000
Directions for questions: Answer the following questions based on the information given below.
The pie chart given below shows the total number of people and the number of women who reads 5 different news paper.
Percentage of people who reads different newspaper in a town
Total number of people = 35,000
Percentage break-up of female who reads different newspaper in town
Total number of females = 15,000
What is the ratio of the number of females who reads dainik jagran to the number of males who reads the telegram?
Directions for questions: Answer the following questions based on the information given below.
The pie chart given below shows the total number of people and the number of women who reads 5 different news paper.
Percentage of people who reads different newspaper in a town
Total number of people = 35,000
Percentage break-up of female who reads different newspaper in town
Total number of females = 15,000
What is the ratio of the number of females who reads dainik jagran to the number of males who reads the telegram?
Required answer: \
5700 : 6050 = 114 : 121
 Upvote

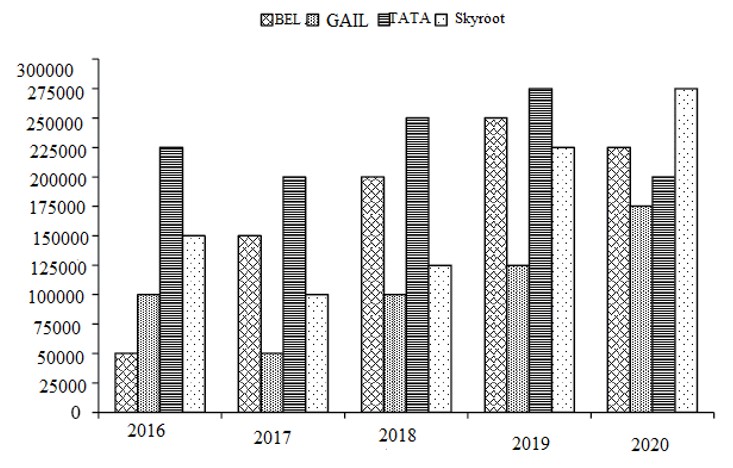
The bar graph above represents the annual consumption of electricity by four different companies – BEl, GAIL,TATA and Skyroot – over five different years, from 2016 through 2020. The table given below indicates the rate (Rs./unit of code) at which each of the four companies paid electricity bills over the given duration (2016-2020).
Companies
Years
2016
2017
2018
2019
2020
Bell
10
11
12
13
14
GAIL
11
12
12
13
14
TATA
12
12
12
13
14
.Skyroot
13
14
15
16
17
The maximum electricity bill by any company is observed in which year?
The bar graph above represents the annual consumption of electricity by four different companies – BEl, GAIL,TATA and Skyroot – over five different years, from 2016 through 2020. The table given below indicates the rate (Rs./unit of code) at which each of the four companies paid electricity bills over the given duration (2016-2020).
|
Companies |
Years |
||||
|
2016 |
2017 |
2018 |
2019 |
2020 |
|
|
Bell |
10 |
11 |
12 |
13 |
14 |
|
GAIL |
11 |
12 |
12 |
13 |
14 |
|
TATA |
12 |
12 |
12 |
13 |
14 |
|
.Skyroot |
13 |
14 |
15 |
16 |
17 |
The maximum electricity bill by any company is observed in which year?
Skyroot's income was the maximum in year 2020, as the rate charged was the maximum and the number of units was also the maximum
Upvote
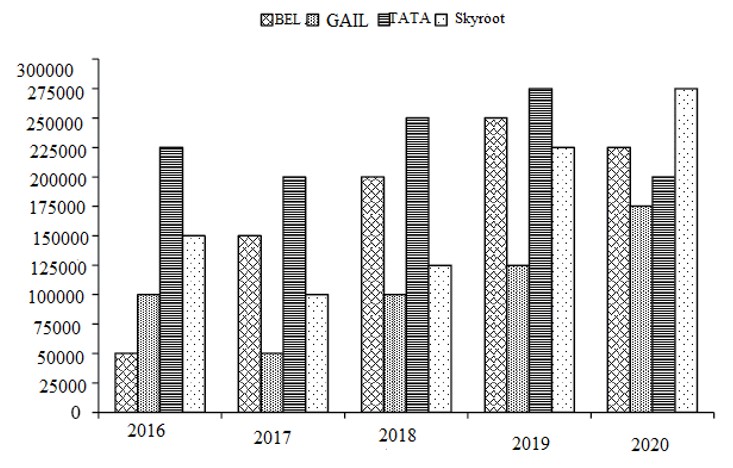
The bar graph above represents the annual consumption of electricity by four different companies – BEl, GAIL,TATA and Skyroot – over five different years, from 2016 through 2020. The table given below indicates the rate (Rs./unit of code) at which each of the four companies paid electricity bills over the given duration (2016-2020).
Companies
Years
2016
2017
2018
2019
2020
Bell
10
11
12
13
14
GAIL
11
12
12
13
14
TATA
12
12
12
13
14
.Skyroot
13
14
15
16
17
The electricity bill of GAIL in the year 2019 expressed as a percentage of that of Skyroot in the year 2016?
The bar graph above represents the annual consumption of electricity by four different companies – BEl, GAIL,TATA and Skyroot – over five different years, from 2016 through 2020. The table given below indicates the rate (Rs./unit of code) at which each of the four companies paid electricity bills over the given duration (2016-2020).
|
Companies |
Years |
||||
|
2016 |
2017 |
2018 |
2019 |
2020 |
|
|
Bell |
10 |
11 |
12 |
13 |
14 |
|
GAIL |
11 |
12 |
12 |
13 |
14 |
|
TATA |
12 |
12 |
12 |
13 |
14 |
|
.Skyroot |
13 |
14 |
15 |
16 |
17 |
The electricity bill of GAIL in the year 2019 expressed as a percentage of that of Skyroot in the year 2016?
There are 6 refineries, 7 depots, 9 districts. The refineries are R1, R2, R3, R4, R5, R6. The depots are D1, D2, D3, D4, D5, D6 and D7 and the districts are DR1, DR2, DR3, DR4, DR5, DR6, DR7, DR8, DR9.
Table A shows the cost of transporting one unit from refinery to depot.
Table B shows the cost of transporting one unit from depot to districts.
Table - A
R1
R2
R3
R4
R5
R6
D1
928.2
537.2
567.8
589.9
800.1
323.4
D2
311.8
595.7
885.7
759.9
793.1
420.1
D3
451.1
0
320.1
720.1
1000.1
404.5
D4
371.1
50.1
350.1
650.4
980.1
525.3
D5
1137.3
314.5
0
1157.7
406.3
617.5
D6
617.1
516.8
756.5
1065.9
623.9
509.4
D7
644.3
299.2
537.2
1093.1
725.8
827.4
Table - B
D1
D2
D3
D4
D5
D6
D7
DR1
571.1
205
352
159
434.5
178
337
DR2
200
337.5
291
201
0
980.7
434
DR3
100
0
275
277
850
770.5
835
DR4
0
415.7
350
760
300
560
444.7
DR5
223.5
300
440
1033
880
325
526.5
DR6
577.5
725
443.5
560
1035.3
570
530
DR7
340
410.6
886.7
0
800.7
680.5
800
DR8
627
556.5
1023
1024
759
1025.7
300
DR9
439
738
980
1031.7
1024
900
757
The minimum cost of transportation of one unit from refinery BD to any district is
There are 6 refineries, 7 depots, 9 districts. The refineries are R1, R2, R3, R4, R5, R6. The depots are D1, D2, D3, D4, D5, D6 and D7 and the districts are DR1, DR2, DR3, DR4, DR5, DR6, DR7, DR8, DR9.
Table A shows the cost of transporting one unit from refinery to depot.
Table B shows the cost of transporting one unit from depot to districts.
|
Table - A |
||||||
|
|
R1 |
R2 |
R3 |
R4 |
R5 |
R6 |
|
D1 |
928.2 |
537.2 |
567.8 |
589.9 |
800.1 |
323.4 |
|
D2 |
311.8 |
595.7 |
885.7 |
759.9 |
793.1 |
420.1 |
|
D3 |
451.1 |
0 |
320.1 |
720.1 |
1000.1 |
404.5 |
|
D4 |
371.1 |
50.1 |
350.1 |
650.4 |
980.1 |
525.3 |
|
D5 |
1137.3 |
314.5 |
0 |
1157.7 |
406.3 |
617.5 |
|
D6 |
617.1 |
516.8 |
756.5 |
1065.9 |
623.9 |
509.4 |
|
D7 |
644.3 |
299.2 |
537.2 |
1093.1 |
725.8 |
827.4 |
|
Table - B |
|||||||
|
|
D1 |
D2 |
D3 |
D4 |
D5 |
D6 |
D7 |
|
DR1 |
571.1 |
205 |
352 |
159 |
434.5 |
178 |
337 |
|
DR2 |
200 |
337.5 |
291 |
201 |
0 |
980.7 |
434 |
|
DR3 |
100 |
0 |
275 |
277 |
850 |
770.5 |
835 |
|
DR4 |
0 |
415.7 |
350 |
760 |
300 |
560 |
444.7 |
|
DR5 |
223.5 |
300 |
440 |
1033 |
880 |
325 |
526.5 |
|
DR6 |
577.5 |
725 |
443.5 |
560 |
1035.3 |
570 |
530 |
|
DR7 |
340 |
410.6 |
886.7 |
0 |
800.7 |
680.5 |
800 |
|
DR8 |
627 |
556.5 |
1023 |
1024 |
759 |
1025.7 |
300 |
|
DR9 |
439 |
738 |
980 |
1031.7 |
1024 |
900 |
757 |
The minimum cost of transportation of one unit from refinery BD to any district is
R4 → D5 → DR2
The least cost to reach to AAB is for AE. And that is BD to AE is zero.
Upvote There are 6 refineries, 7 depots, 9 districts. The refineries are R1, R2, R3, R4, R5, R6. The depots are D1, D2, D3, D4, D5, D6 and D7 and the districts are DR1, DR2, DR3, DR4, DR5, DR6, DR7, DR8, DR9.
Table A shows the cost of transporting one unit from refinery to depot.
Table B shows the cost of transporting one unit from depot to districts.
Table - A
R1
R2
R3
R4
R5
R6
D1
928.2
537.2
567.8
589.9
800.1
323.4
D2
311.8
595.7
885.7
759.9
793.1
420.1
D3
451.1
0
320.1
720.1
1000.1
404.5
D4
371.1
50.1
350.1
650.4
980.1
525.3
D5
1137.3
314.5
0
1157.7
406.3
617.5
D6
617.1
516.8
756.5
1065.9
623.9
509.4
D7
644.3
299.2
537.2
1093.1
725.8
827.4
Table - B
D1
D2
D3
D4
D5
D6
D7
DR1
571.1
205
352
159
434.5
178
337
DR2
200
337.5
291
201
0
980.7
434
DR3
100
0
275
277
850
770.5
835
DR4
0
415.7
350
760
300
560
444.7
DR5
223.5
300
440
1033
880
325
526.5
DR6
577.5
725
443.5
560
1035.3
570
530
DR7
340
410.6
886.7
0
800.7
680.5
800
DR8
627
556.5
1023
1024
759
1025.7
300
DR9
439
738
980
1031.7
1024
900
757
The largest cost of sending one unit from any refinery to district is
There are 6 refineries, 7 depots, 9 districts. The refineries are R1, R2, R3, R4, R5, R6. The depots are D1, D2, D3, D4, D5, D6 and D7 and the districts are DR1, DR2, DR3, DR4, DR5, DR6, DR7, DR8, DR9.
Table A shows the cost of transporting one unit from refinery to depot.
Table B shows the cost of transporting one unit from depot to districts.
|
Table - A |
||||||
|
|
R1 |
R2 |
R3 |
R4 |
R5 |
R6 |
|
D1 |
928.2 |
537.2 |
567.8 |
589.9 |
800.1 |
323.4 |
|
D2 |
311.8 |
595.7 |
885.7 |
759.9 |
793.1 |
420.1 |
|
D3 |
451.1 |
0 |
320.1 |
720.1 |
1000.1 |
404.5 |
|
D4 |
371.1 |
50.1 |
350.1 |
650.4 |
980.1 |
525.3 |
|
D5 |
1137.3 |
314.5 |
0 |
1157.7 |
406.3 |
617.5 |
|
D6 |
617.1 |
516.8 |
756.5 |
1065.9 |
623.9 |
509.4 |
|
D7 |
644.3 |
299.2 |
537.2 |
1093.1 |
725.8 |
827.4 |
|
Table - B |
|||||||
|
|
D1 |
D2 |
D3 |
D4 |
D5 |
D6 |
D7 |
|
DR1 |
571.1 |
205 |
352 |
159 |
434.5 |
178 |
337 |
|
DR2 |
200 |
337.5 |
291 |
201 |
0 |
980.7 |
434 |
|
DR3 |
100 |
0 |
275 |
277 |
850 |
770.5 |
835 |
|
DR4 |
0 |
415.7 |
350 |
760 |
300 |
560 |
444.7 |
|
DR5 |
223.5 |
300 |
440 |
1033 |
880 |
325 |
526.5 |
|
DR6 |
577.5 |
725 |
443.5 |
560 |
1035.3 |
570 |
530 |
|
DR7 |
340 |
410.6 |
886.7 |
0 |
800.7 |
680.5 |
800 |
|
DR8 |
627 |
556.5 |
1023 |
1024 |
759 |
1025.7 |
300 |
|
DR9 |
439 |
738 |
980 |
1031.7 |
1024 |
900 |
757 |
The largest cost of sending one unit from any refinery to district is
If you look for large figures you would find them in both tables in D5.
the largest cost = 1157.7 + 1035.3
= 2193.00
Upvote There are 6 refineries, 7 depots, 9 districts. The refineries are R1, R2, R3, R4, R5, R6. The depots are D1, D2, D3, D4, D5, D6 and D7 and the districts are DR1, DR2, DR3, DR4, DR5, DR6, DR7, DR8, DR9.
Table A shows the cost of transporting one unit from refinery to depot.
Table B shows the cost of transporting one unit from depot to districts.
Table - A
R1
R2
R3
R4
R5
R6
D1
928.2
537.2
567.8
589.9
800.1
323.4
D2
311.8
595.7
885.7
759.9
793.1
420.1
D3
451.1
0
320.1
720.1
1000.1
404.5
D4
371.1
50.1
350.1
650.4
980.1
525.3
D5
1137.3
314.5
0
1157.7
406.3
617.5
D6
617.1
516.8
756.5
1065.9
623.9
509.4
D7
644.3
299.2
537.2
1093.1
725.8
827.4
Table - B
D1
D2
D3
D4
D5
D6
D7
DR1
571.1
205
352
159
434.5
178
337
DR2
200
337.5
291
201
0
980.7
434
DR3
100
0
275
277
850
770.5
835
DR4
0
415.7
350
760
300
560
444.7
DR5
223.5
300
440
1033
880
325
526.5
DR6
577.5
725
443.5
560
1035.3
570
530
DR7
340
410.6
886.7
0
800.7
680.5
800
DR8
627
556.5
1023
1024
759
1025.7
300
DR9
439
738
980
1031.7
1024
900
757
How many possible ways are there for sending one unit from any refinery to any district?
There are 6 refineries, 7 depots, 9 districts. The refineries are R1, R2, R3, R4, R5, R6. The depots are D1, D2, D3, D4, D5, D6 and D7 and the districts are DR1, DR2, DR3, DR4, DR5, DR6, DR7, DR8, DR9.
Table A shows the cost of transporting one unit from refinery to depot.
Table B shows the cost of transporting one unit from depot to districts.
|
Table - A |
||||||
|
|
R1 |
R2 |
R3 |
R4 |
R5 |
R6 |
|
D1 |
928.2 |
537.2 |
567.8 |
589.9 |
800.1 |
323.4 |
|
D2 |
311.8 |
595.7 |
885.7 |
759.9 |
793.1 |
420.1 |
|
D3 |
451.1 |
0 |
320.1 |
720.1 |
1000.1 |
404.5 |
|
D4 |
371.1 |
50.1 |
350.1 |
650.4 |
980.1 |
525.3 |
|
D5 |
1137.3 |
314.5 |
0 |
1157.7 |
406.3 |
617.5 |
|
D6 |
617.1 |
516.8 |
756.5 |
1065.9 |
623.9 |
509.4 |
|
D7 |
644.3 |
299.2 |
537.2 |
1093.1 |
725.8 |
827.4 |
|
Table - B |
|||||||
|
|
D1 |
D2 |
D3 |
D4 |
D5 |
D6 |
D7 |
|
DR1 |
571.1 |
205 |
352 |
159 |
434.5 |
178 |
337 |
|
DR2 |
200 |
337.5 |
291 |
201 |
0 |
980.7 |
434 |
|
DR3 |
100 |
0 |
275 |
277 |
850 |
770.5 |
835 |
|
DR4 |
0 |
415.7 |
350 |
760 |
300 |
560 |
444.7 |
|
DR5 |
223.5 |
300 |
440 |
1033 |
880 |
325 |
526.5 |
|
DR6 |
577.5 |
725 |
443.5 |
560 |
1035.3 |
570 |
530 |
|
DR7 |
340 |
410.6 |
886.7 |
0 |
800.7 |
680.5 |
800 |
|
DR8 |
627 |
556.5 |
1023 |
1024 |
759 |
1025.7 |
300 |
|
DR9 |
439 |
738 |
980 |
1031.7 |
1024 |
900 |
757 |
How many possible ways are there for sending one unit from any refinery to any district?
Number of refineries = 6
Number of depots = 7
Number of districts = 9
Therefore, number of possible ways to send petrol from any refinery to any district is 6 * 7 * 9 = 378.
Upvote A college stores data on students, showing their gender and performance, on a computer disc. Due to virus, some of the data is lost and only the following could be recovered.
Study the table carefully and answer the questions given below it.
Performance
Total
Average
Good
Excellent
Male
50
Female
96
Total
54
However, an expert committee arrived at the following conclusions
I. One-third of the male students were ‘average’.
II. 40% of the students were female.
III. Half the total numbers of students were ‘excellent’.
What fraction of total excellent students are female excellent students?
A college stores data on students, showing their gender and performance, on a computer disc. Due to virus, some of the data is lost and only the following could be recovered.
Study the table carefully and answer the questions given below it.
|
|
Performance |
Total |
||
|
Average |
Good |
Excellent |
||
|
Male |
|
|
50 |
|
|
Female |
|
|
|
96 |
|
Total |
|
54 |
|
|
However, an expert committee arrived at the following conclusions
I. One-third of the male students were ‘average’.
II. 40% of the students were female.
III. Half the total numbers of students were ‘excellent’.
What fraction of total excellent students are female excellent students?
Total number of excellent students = 120
Number of female excellent students = 70
Required fraction
Upvote A college stores data on students, showing their gender and performance, on a computer disc. Due to virus, some of the data is lost and only the following could be recovered.
Study the table carefully and answer the questions given below it.
Performance
Total
Average
Good
Excellent
Male
50
Female
96
Total
54
However, an expert committee arrived at the following conclusions
I. One-third of the male students were ‘average’.
II. 40% of the students were female.
III. Half the total numbers of students were ‘excellent’.
The ratio of female ‘good’ students to male ‘average’ students is
A college stores data on students, showing their gender and performance, on a computer disc. Due to virus, some of the data is lost and only the following could be recovered.
Study the table carefully and answer the questions given below it.
|
|
Performance |
Total |
||
|
Average |
Good |
Excellent |
||
|
Male |
|
|
50 |
|
|
Female |
|
|
|
96 |
|
Total |
|
54 |
|
|
However, an expert committee arrived at the following conclusions
I. One-third of the male students were ‘average’.
II. 40% of the students were female.
III. Half the total numbers of students were ‘excellent’.
The ratio of female ‘good’ students to male ‘average’ students is
Number of female good students = 8
Number of males average students = 48
Required ratio = 8 : 48 = 1 : 6
Upvote