

Statistics
Get insights from 151 questions on Statistics, answered by students, alumni, and experts. You may also ask and answer any question you like about Statistics
Follow Ask QuestionQuestions
Discussions
Active Users
Followers
New answer posted
9 months agoContributor-Level 10
Variance =
Let 2a2 – a + 1 = 5x
D = 1 – 4 (2) (1 – 5n)
= 40n – 7, which is not
As each square form is
New answer posted
9 months agoContributor-Level 10
Variance of 2001, 2003, 2006, 2007, 2009, 2010 is same as variance of 1, 3, 6, 7, 9, 10
mean =
var (x) =
var (x) = 10
New answer posted
9 months agoContributor-Level 10
C.V. = (σ/x? ) * 100 ⇒ σ = (C.V. * x? ) / 100
∴ σ? = (50*30)/100 = 15 and σ? = (60*25)/100 = 15 ⇒ σ? - σ? = 0
New answer posted
10 months ago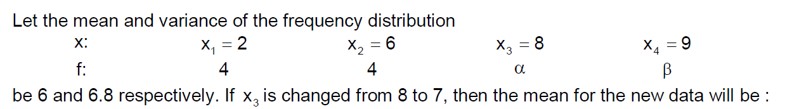
Contributor-Level 10
mean = Σx? f? /Σf? = (32+8α+9β)/ (8+α+β)=6
⇒2α+3β=16 . (i)
d? =x? −x? =−4,0,2,3
f? d? ²=64,0,4α,9β
Variance σ²=Σf? d? ²/Σf? =6.8
⇒ (64+4α+9β)/ (8+α+β)=6.8
⇒2.8α+ (−2.2β)=9.6
⇒28α−22β=96
14α−11β=48 . (ii)
Solving (i) and (ii),
⇒β=2, α=5
New mean=Σx? f? /Σf? =85/15=17/3
New answer posted
10 months agoContributor-Level 10
Var (1, 2, ., n) = (Σn²/n) - (Σn/n)² = 10.
(n (n+1) (2n+1)/6n) - (n (n+1)/2n)² = 10.
(n+1) (2n+1)/6 - (n+1)/2)² = 10.
(n+1)/12 * [2 (2n+1) - 3 (n+1)] = 10.
(n+1)/12 * (4n+2 - 3n-3) = 10.
(n+1) (n-1)/12 = 10.
n² - 1 = 120 ⇒ n² = 121 ⇒ n = 11.
Var (2, 4, ., 2m) = Var (2* (1, 2, ., m) = 2² * Var (1, 2, ., m) = 16.
4 * Var (1, 2, ., m) = 16.
Var (1, 2, ., m) = 4.
Using the formula from above: (m²-1)/12 = 4.
m² - 1 = 48 ⇒ m² = 49 ⇒ m = 7.
m + n = 7 + 11 = 18.
New answer posted
10 months ago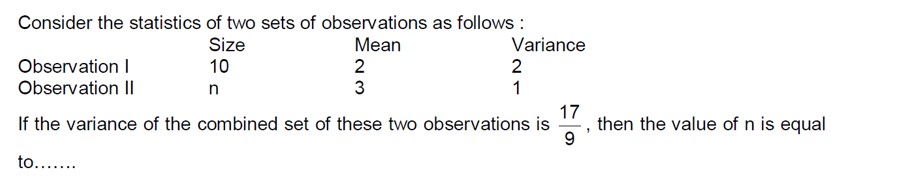
Contributor-Level 10
1st observation: n? =10, mean x? =2, variance σ? ²=2.
Σx? = n? x? = 20.
σ? ² = (Σx? ² / n? ) - x? ² => 2 = (Σx? ²/10) - 2² => 6 = Σx? ²/10 => Σx? ² = 60.
2nd observation: n? , mean y? =3, variance σ? ²=1. Let n? =n.
Σy? = ny? = 3n.
σ? ² = (Σy? ² / n) - y? ² => 1 = (Σy? ²/n) - 3² => 10 = Σy? ²/n => Σy? ² = 10n.
Combined variance σ² = 17/9. n_total = 10+n.
Combined mean = (Σx? +Σy? )/ (10+n) = (20+3n)/ (10+n).
Combined Σ (squares) = 60+10n.
σ² = (Combined Σsq / n_total) - (Combined mean)²
17/9 = (60+10n)/ (10+n) - [ (20+3n)/ (10+n)]²
Multiply by 9 (10+n)²:
17 (10+n)² = 9 (60+10n) (10+n) - 9 (20+3n)²
17 (100+
New answer posted
10 months agoContributor-Level 10
The data consists of n values of a and n values of -a.
Mean x? = (n*a + n* (-a) / 2n = 0 / 2n = 0.
Variance σ² = (Σx? ²)/N - x? ² = (n*a² + n* (-a)²) / 2n - 0² = 2na² / 2n = a².
If a value b is added to all observations, the new mean is x? ' = x? + b = 0 + b = b.
We are given the new mean is 5, so b=5.
Adding a constant does not change the variance. The new variance is still a².
We are given the new standard deviation is 20, so the new variance is 20² = 400.
Thus, a² = 400.
The required value is a² + b² = 400 + 5² = 400 + 25 = 425.
New answer posted
10 months agoContributor-Level 10
x? = (2+4+10+12+14+x+y)/7 = 8
⇒ 42+x+y = 56 ⇒ x+y = 14
σ² = (Σx? ²/n) - (x? )²
16 = (4+16+100+144+196+x²+y²)/7 - (8)²
⇒ 16+64 = (460+x²+y²)/7
⇒ 560 = 460+x²+y² ⇒ x²+y² = 100
⇒ xy=48
(x-y)² = (x+y)² - 4xy = 4
|x-y| = 2
Taking an Exam? Selecting a College?
Get authentic answers from experts, students and alumni that you won't find anywhere else
Sign Up on ShikshaOn Shiksha, get access to
- 66k Colleges
- 1.2k Exams
- 703k Reviews
- 1850k Answers