
DILR Preparation Tips for MBA
Get insights from 171 questions on DILR Preparation Tips for MBA, answered by students, alumni, and experts. You may also ask and answer any question you like about DILR Preparation Tips for MBA
- 171
Questions
- 0
Discussions
- 0
Active Users
- 1
Followers
Have a question about DILR Preparation Tips for MBA? Ask our experts
Keep it short & simple. Type complete word. Avoid abusive language.
The line chart given below shows the yearly production of Amul and Nutralite butter.
The bar chart given below it shows the Female and male population in these years.
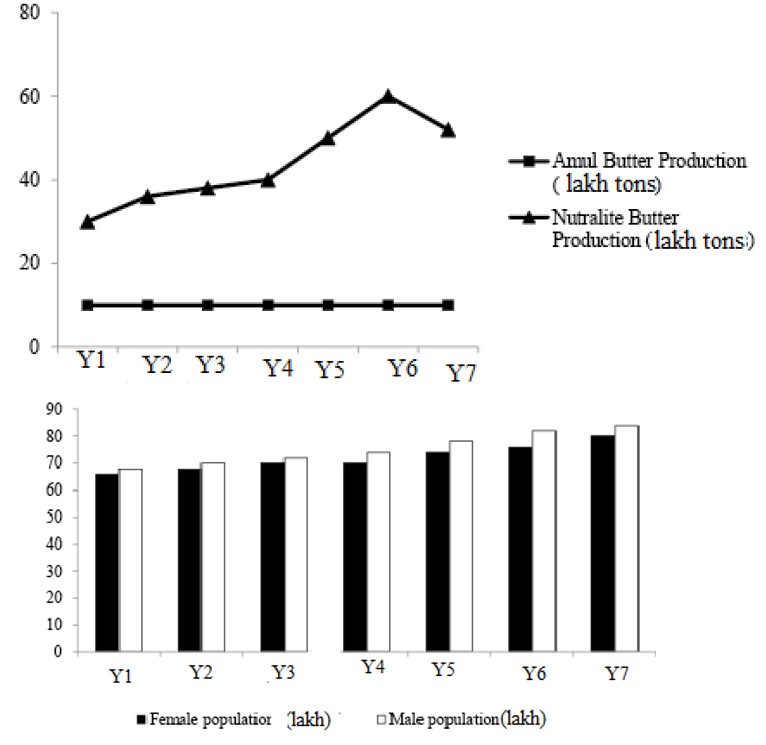
In which year was per capita production of Nutralite Butter the most?
The line chart given below shows the yearly production of Amul and Nutralite butter.
The bar chart given below it shows the Female and male population in these years.
In which year was per capita production of Nutralite Butter the most?
The per capita production of Nutralite Butter was the most in 2013. (by observation)
 Upvote

The total cost for making 10 books is divided into different heads as shown in the pie chart below.
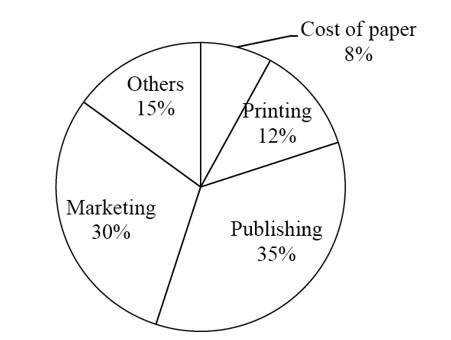
If the Marketing cost increases by 20% and all other remaining costs remains the same, then what is the percentage share of Marketing cost after the increase of the total cost of writing the book? (approximately)
The total cost for making 10 books is divided into different heads as shown in the pie chart below.
If the Marketing cost increases by 20% and all other remaining costs remains the same, then what is the percentage share of Marketing cost after the increase of the total cost of writing the book? (approximately)
Let the total cost is 100, then Marketing cost = 30, New Marketing cost after the increase of 20% = 1.2 (30) = 36, New Total cost = 106. So, the percentage shown of Marketing cost.
Upvote The total cost for making 10 books is divided into different heads as shown in the pie chart below.
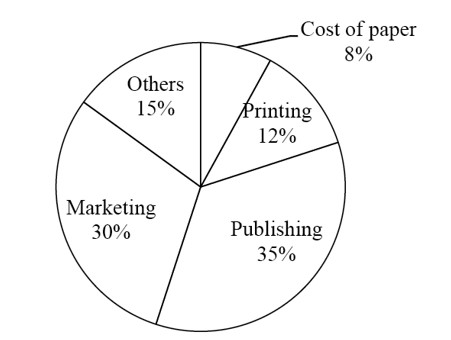
The total cost for making 10 books is divided into different heads as shown in the pie chart below.
Let the total cost is 100, then Publishing cost = 35% of 100 = 35 & Marketing Cost = 30 % of 100 = 30. So, by the Publishing cost is 16.66% more than the Marketing cost.
Upvote The total cost for making 10 books is divided into different heads as shown in the pie chart below.
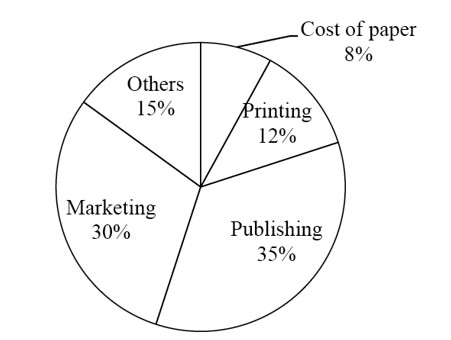
If the cost of Printing is Rs. 14400. Then what will be the cost of Others?
The total cost for making 10 books is divided into different heads as shown in the pie chart below.
If the cost of Printing is Rs. 14400. Then what will be the cost of Others?
Let the total cost of writing the book is x.
So, 12 % of x =14400, Cost of Others = 15% of Total cost = 15 % of 1,20,000 = 18,000.
Upvote Directions for questions: Answer the questions on the basis of the information give below.
The total cost for making 10 books is divided into different heads as shown in the pie chart below.<!--[endif]-->
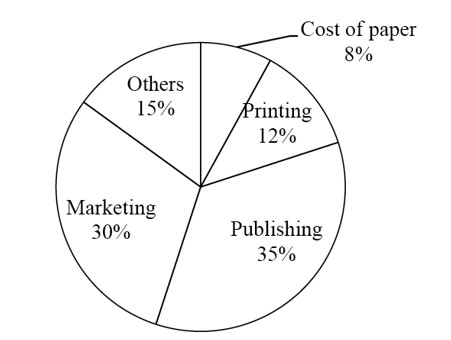
What is the central angle showing the cost of Paper?
Directions for questions: Answer the questions on the basis of the information give below.
The total cost for making 10 books is divided into different heads as shown in the pie chart below.<!--[endif]-->
What is the central angle showing the cost of Paper?
Shown of Printing is 8 % of the total cost. Here 100% = 360°. So, 1% = 3.6°.
So, central angle = 8 * 3.6 = 28.8°
Upvote The monthly, sales turnover of colour TV of four companies-C1, C2 C3 and C4, from the April through September, 2001.
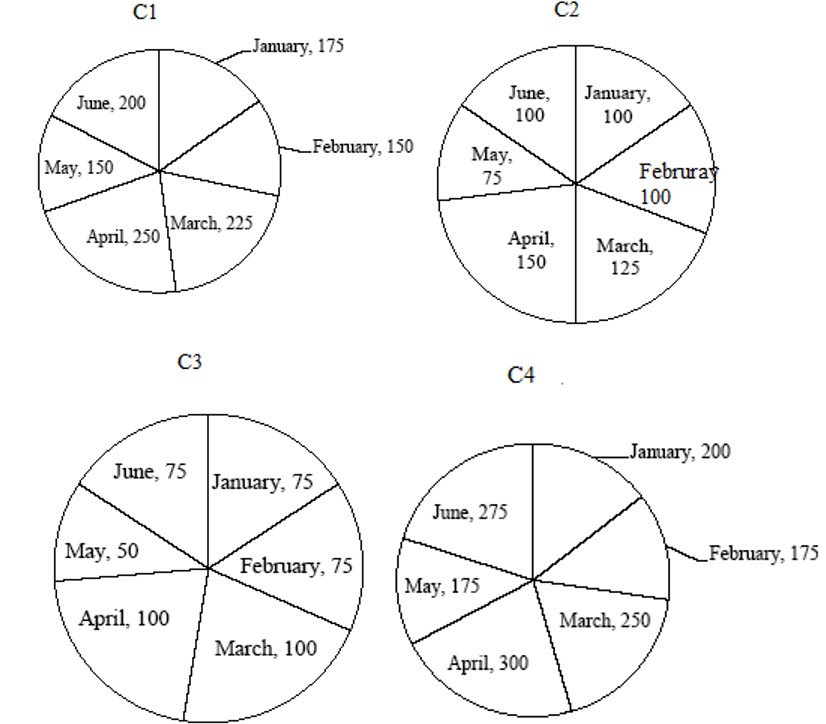
Which of the following statements must be true?
The monthly, sales turnover of colour TV of four companies-C1, C2 C3 and C4, from the April through September, 2001.
Which of the following statements must be true?
Verify the choices one by one.
(a) The total sales of all the four companies was different in each month, hence (a) is false.
(b) For the given period:
Total Sales of C1 = 175 +150 + 225 + 250 + 150 + 200 = 1150.
Total Sales of C3 = 75 + 75 + 100 + 100 + 50 + 75 = 475.
Hence, (b) is false.
(c) Total Sa
Upvote The monthly, sales turnover of colour TV of four companies-C1, C2 C3 and C4, from the April through September, 2001.
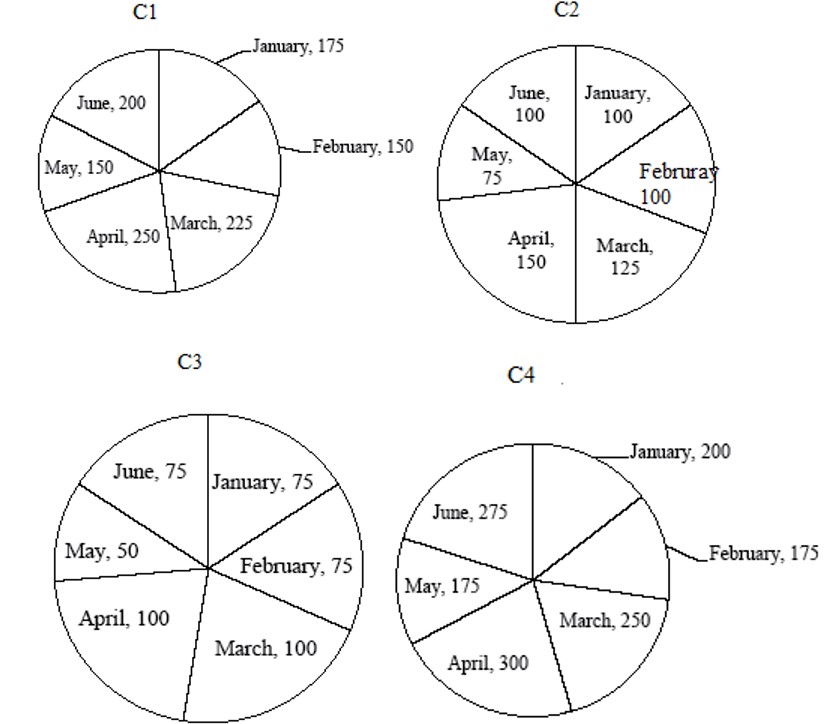
In how many months, from February to June, did the sales turnover of C3 as percentage of the total sales turnover of the four companies increase over that of its immediate preceding month?
The monthly, sales turnover of colour TV of four companies-C1, C2 C3 and C4, from the April through September, 2001.
In how many months, from February to June, did the sales turnover of C3 as percentage of the total sales turnover of the four companies increase over that of its immediate preceding month?
Month = C3/Total Sales*100
January
February
March
April
May
June
Upvote The monthly, sales turnover of colour TV of four companies-C1, C2 C3 and C4, from the April through September, 2001.
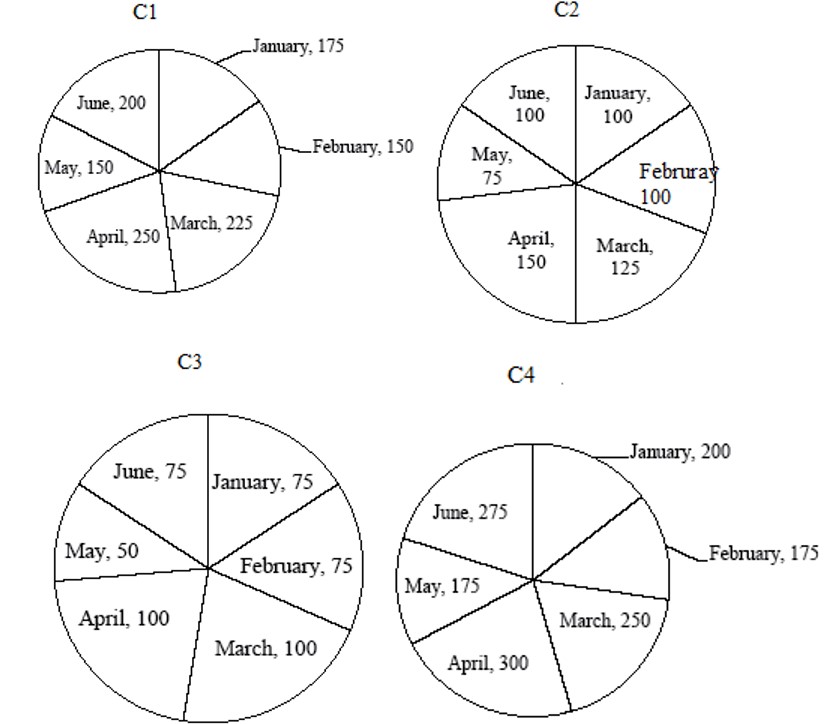
In how many months was the sales turnover of C1 more than one-third of the total sales turnover of the four companies?
The monthly, sales turnover of colour TV of four companies-C1, C2 C3 and C4, from the April through September, 2001.
In how many months was the sales turnover of C1 more than one-third of the total sales turnover of the four companies?
Month = C1/Total Sales * 100
January
February
March
April
May
June
No month have sales more than 33.33%. Hence option (d)
Upvote Directions for questions: Answer the questions on the basis of the information given below.
The monthly, sales turnover of colour TV of four companies-C1, C2 C3 and C4, from the April through September, 2001.
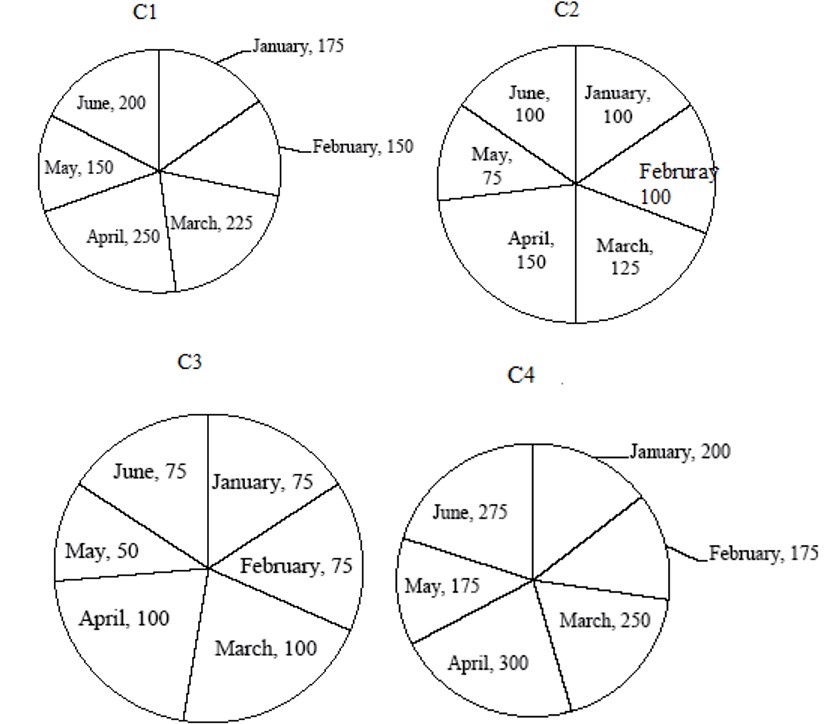
In which of the given months is the sales turnover of C3 as a percentage of the combined sales turnover of C2 and C4 the most?
Directions for questions: Answer the questions on the basis of the information given below.
The monthly, sales turnover of colour TV of four companies-C1, C2 C3 and C4, from the April through September, 2001.
In which of the given months is the sales turnover of C3 as a percentage of the combined sales turnover of C2 and C4 the most?
Month = C3/ (C2+C4)
January
February
March
April
May
June
Hence, the required percentage was the most in the month of February.
Upvote Percentage Sales of Different brands of Rice in Delhi in Two Different Years

Percentage Sales of Different brands of Rice in Delhi in Two Different Years
Required Ratio
= Increase in R4/ Increase in R3
Upvote