Reservation in Higher Education: Category-wise Student Enrollment in Universities & Colleges
Reservation quota in context of Indian higher education system basically means that a set percentage of seats is reserved in all universities and colleges for students who are socially and educationally backward or belong to different castes such as SC and ST. In Indian higher education institutions, 15% and 7.5% seats are reserved for SC and ST category candidates, respectively. Apart from that, 27% seats are reserved by the government for OBC category students. Check out the latest report of AISHE in the article below.

Reservation in Higher Education
Source: AISHE Report, 2020-21
Reservations or quotas have been an integral part of the Indian higher education system. Over the years many students from reserved categories, especially those belonging to Scheduled Caste (SC), Scheduled Tribe (ST), and Other Backward Classes (OBC), have been admitted in reputed universities and colleges of India basis quota.
Reservation quota in context of Indian higher education system basically means that a set percentage of seats is reserved in all universities and colleges for students who are socially and educationally backward or belong to different castes such as SC and ST.
In Indian higher education institutions, 15% and 7.5% seats are reserved for SC and ST category candidates, respectively. Apart from that, 27% seats are reserved by the government for OBC category students. This takes the total percentage of reservation in Indian colleges and universities to 49.5%, leaving 50.5% of available seats for General category candidates.

Category-wise Student Enrollment 2016 to 2021
As per All India Survey on Higher Education (AISHE) report 2020-21, total enrolment in higher education has increased to nearly 4.13 crore in 2020-21 from 3.85 crore in 2019-20 (increase of 28.80 Lakh). The annual rate of increase in enrolment has also shown an improvement over the years. The increase in enrolment in 2020-21 over 2019-20 is 7.4%, which was 3% during 2019-20 and 2.7% during 2018-19. Further, overall increase in enrolment since 2014-15 is 20.9%. A total of 2.12 crore (51.3%) male and 2.01 crore (48.7%) female students were enrolled in Higher Education.
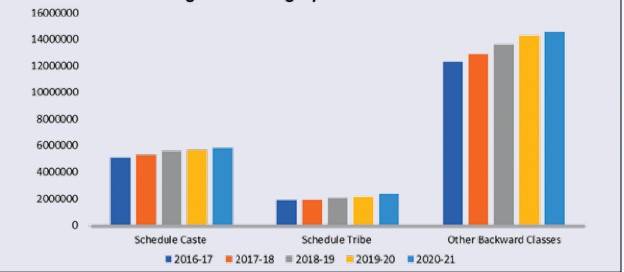
[Given in the graph above are statistics of five years (2016-2021) regarding enrollment of General, SC, ST, and OBC category students in Indian universities and colleges.]
In 2019-20, number of male students enrolled was 1.96 crore and female students enrolled was 1.89 crore. Of the 4.13 crore students enrolled in 2020-21, 14.2% belong to Scheduled Castes, 5.8% belong to Scheduled Tribes, 35.8% are from Other Backward Classes and remaining 44.2% students are from other communities. The growth in enrolment of Scheduled Caste students in 2020-21 as compared to 2019-20 is 4.2%, whereas, the growth in 2019-20 over 2018-19 was 1.6%. Further, overall increase in SC Student enrolment since 2014-15 is 27.96%. Enrolment of Scheduled Tribes students has increased to 24.1 lakh in 2020-21 from 21.6 lakh in 2019-20. This increase (11.9%) is significantly higher than the increase recorded in previous year (4.3%). Notably, overall increase in ST Student enrolment since 2014-15 is 47%. Enrolment of students from Other Backward Classes has increased to about 1.48 crore in 2020-21 from 1.42 crore in 2019-20. Also, overall increase in OBC Student enrolment since 2014-15 is 31.67%.
Category-wise Student Enrollment from 2011 to 2015
| Year |
SC Enrollment |
ST Enrollment |
OBC Enrollment |
Total Enrollment |
|---|---|---|---|---|
| 2011-12 |
35,72,074 |
13,10,261 |
87,72,138 |
1,36,54,473 |
| 2012-13 |
38,47,942 |
13,20,361 |
94,16,299 |
1,45,84,602 |
| 2013-14 |
42,38,207 |
14,86,512 |
1,04,64,043 |
1,58,88,762 |
| 2014-15 |
46,06,666 |
16,40,809 |
1,12,56,849 |
1,75,04,324 |
| 2015-16 |
48,10,314 |
17,04,461 |
1,16,73,535 |
1,81,88,310 |
As shown in the table above, in 2011-12, a total of 1,36,54,473 (46.8%) SC, ST, and OBC candidates secured admission in different universities and colleges. However, in 2015-16 the student enrollment number (for SC, ST, OBC categories) went up to 1,81,88,310 (52.6%).
It may be noted here that in the last five years starting from 2011-12 to 2015-16, total number of students (irrespective of their category) enrolled in different universities and colleges has also considerably increased as shown in the table below:
| Year |
Total Student Enrollment |
|---|---|
| 2011-12 |
2,91,84,331 |
| 2012-13 |
3,01,52,417 |
| 2013-14 |
3,23,36,234 |
| 2014-15 |
3,42,11,637 |
| 2015-16 |
3,45,84,781 |
Statistics in terms of increasing number of students availing higher education every year look promising. However, the year on year decreasing graph of General category students’ enrollment in higher education institutions might be a situation of concern in future.
Read More:

Comments