
DILR Preparation Tips for MBA
Get insights from 171 questions on DILR Preparation Tips for MBA, answered by students, alumni, and experts. You may also ask and answer any question you like about DILR Preparation Tips for MBA
- 171
Questions
- 0
Discussions
- 0
Active Users
- 1
Followers
Have a question about DILR Preparation Tips for MBA? Ask our experts
Keep it short & simple. Type complete word. Avoid abusive language.


The given graphs which show the Seats won and the percentage of valid votes polled for different political parties in a state for different election years
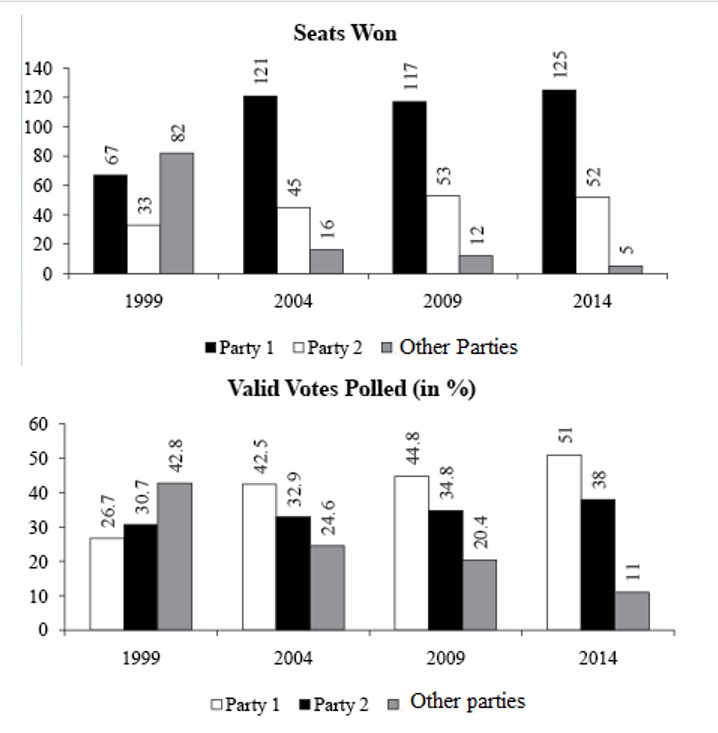
The given graphs which show the Seats won and the percentage of valid votes polled for different political parties in a state for different election years
Total votes in 2009 = (2.24/44.8)*100=5 crore
Total Votes in 1999 = (1.228/30.7)*100= 4 crore
4 cr. is 20% less than 5 cr.
 Upvote

The following table gives year wise and course wise admission to a college.
Sports
2016
2017
2018
2019
2021
2022
Course 1
160
200
250
150
140
160
Course 2
40
80
95
100
110
130
Course 3
80
120
120
110
150
130
Course 4
70
90
50
30
60
80
Course 5
100
140
180
200
250
300
Course 6
10
10
20
10
10
10
Total
460
640
715
600
720
810
For which course the total admission for all the 6 years is closest to the total admission for any one of the years?
The following table gives year wise and course wise admission to a college.
|
Sports |
2016 |
2017 |
2018 |
2019 |
2021 |
2022 |
|
Course 1 |
160 |
200 |
250 |
150 |
140 |
160 |
|
Course 2 |
40 |
80 |
95 |
100 |
110 |
130 |
|
Course 3 |
80 |
120 |
120 |
110 |
150 |
130 |
|
Course 4 |
70 |
90 |
50 |
30 |
60 |
80 |
|
Course 5 |
100 |
140 |
180 |
200 |
250 |
300 |
|
Course 6 |
10 |
10 |
20 |
10 |
10 |
10 |
|
Total |
460 |
640 |
715 |
600 |
720 |
810 |
For which course the total admission for all the 6 years is closest to the total admission for any one of the years?
Total admission for each course:
Course 2 = 40 + 80 + 95 + 100 + 110 + 130 = 555,
Course 5 = 100 + 140 + 180 + 200 + 250 + 300 = 234,
Course 4 = 14 + 18 + 10 + 6 + 12 + 16 = 1170,
Course 3 = 80 + 120 + 120 + 110 + 150 + 130 = 710.
Upvote The following table gives year wise and course wise admission to a college.
Sports
2016
2017
2018
2019
2021
2022
Course 1
160
200
250
150
140
160
Course 2
40
80
95
100
110
130
Course 3
80
120
120
110
150
130
Course 4
70
90
50
30
60
80
Course 5
100
140
180
200
250
300
Course 6
10
10
20
10
10
10
Total
460
640
715
600
720
810
In which year the admission to course 1 as percentage of total admission?
The following table gives year wise and course wise admission to a college.
|
Sports |
2016 |
2017 |
2018 |
2019 |
2021 |
2022 |
|
Course 1 |
160 |
200 |
250 |
150 |
140 |
160 |
|
Course 2 |
40 |
80 |
95 |
100 |
110 |
130 |
|
Course 3 |
80 |
120 |
120 |
110 |
150 |
130 |
|
Course 4 |
70 |
90 |
50 |
30 |
60 |
80 |
|
Course 5 |
100 |
140 |
180 |
200 |
250 |
300 |
|
Course 6 |
10 |
10 |
20 |
10 |
10 |
10 |
|
Total |
460 |
640 |
715 |
600 |
720 |
810 |
In which year the admission to course 1 as percentage of total admission?

It is the highest for the year 2011.
Upvote The following table gives year wise and course wise admission to a college.
Sports
2016
2017
2018
2019
2021
2022
Course 1
160
200
250
150
140
160
Course 2
40
80
95
100
110
130
Course 3
80
120
120
110
150
130
Course 4
70
90
50
30
60
80
Course 5
100
140
180
200
250
300
Course 6
10
10
20
10
10
10
Total
460
640
715
600
720
810
Admission in which course showed the greatest decline 2017 and 2019 selections?
The following table gives year wise and course wise admission to a college.
|
Sports |
2016 |
2017 |
2018 |
2019 |
2021 |
2022 |
|
Course 1 |
160 |
200 |
250 |
150 |
140 |
160 |
|
Course 2 |
40 |
80 |
95 |
100 |
110 |
130 |
|
Course 3 |
80 |
120 |
120 |
110 |
150 |
130 |
|
Course 4 |
70 |
90 |
50 |
30 |
60 |
80 |
|
Course 5 |
100 |
140 |
180 |
200 |
250 |
300 |
|
Course 6 |
10 |
10 |
20 |
10 |
10 |
10 |
|
Total |
460 |
640 |
715 |
600 |
720 |
810 |
Admission in which course showed the greatest decline 2017 and 2019 selections?
The greatest decline happened for Course 4 which is =.18-6/18*100 = 66%
Upvote Directions for questions: Answer the questions on the basis of the information give below.
The following table gives year wise and course wise admission to a college.
Sports
2016
2017
2018
2019
2021
2022
Course 1
160
200
250
150
140
160
Course 2
40
80
95
100
110
130
Course 3
80
120
120
110
150
130
Course 4
70
90
50
30
60
80
Course 5
100
140
180
200
250
300
Course 6
10
10
20
10
10
10
Total
460
640
715
600
720
810
In which year for the first time, the course constituted more than 25% of the admission?
Directions for questions: Answer the questions on the basis of the information give below.
The following table gives year wise and course wise admission to a college.
|
Sports |
2016 |
2017 |
2018 |
2019 |
2021 |
2022 |
|
Course 1 |
160 |
200 |
250 |
150 |
140 |
160 |
|
Course 2 |
40 |
80 |
95 |
100 |
110 |
130 |
|
Course 3 |
80 |
120 |
120 |
110 |
150 |
130 |
|
Course 4 |
70 |
90 |
50 |
30 |
60 |
80 |
|
Course 5 |
100 |
140 |
180 |
200 |
250 |
300 |
|
Course 6 |
10 |
10 |
20 |
10 |
10 |
10 |
|
Total |
460 |
640 |
715 |
600 |
720 |
810 |
In which year for the first time, the course constituted more than 25% of the admission?
In the two years, 2018 & 2019, the required percentage is more than 25 % but it happened in 2011 for the first time.
Upvote The table below presents the revenue (in million rupees) of four firms in three states. These firms, F1, F2., F3. And F4. are disguised in the table as A, B, C and D, in no particular order.
States
Firm A
Firm B
Firm C
Firm D
S1
49
82
80
55
S2
69
72
70
65
S3
72
63
72
65
Further, it is known that:
In the state of S3, F3. has the highest market share.
F2.’s aggregate revenue differs from F2.’s by Rs. 5 Crore.
If F4.’s lowest revenue is from S1, then which of the following is true?
The table below presents the revenue (in million rupees) of four firms in three states. These firms, F1, F2., F3. And F4. are disguised in the table as A, B, C and D, in no particular order.
|
States |
Firm A |
Firm B |
Firm C |
Firm D |
|
S1 |
49 |
82 |
80 |
55 |
|
S2 |
69 |
72 |
70 |
65 |
|
S3 |
72 |
63 |
72 |
65 |
Further, it is known that:
In the state of S3, F3. has the highest market share.
F2.’s aggregate revenue differs from F2.’s by Rs. 5 Crore.
If F4.’s lowest revenue is from S1, then which of the following is true?
Profitable can be either A or D. Then aggressive and honest has to be B and C. Hence, truthful is A or D. And for both A and D the lowest revenue is from S1
Upvote The table below presents the revenue (in million rupees) of four firms in three states. These firms, F1, F2., F3. And F4. are disguised in the table as A, B, C and D, in no particular order.
States
Firm A
Firm B
Firm C
Firm D
S1
49
82
80
55
S2
69
72
70
65
S3
72
63
72
65
Further, it is known that:
In the state of S3, F3. has the highest market share.
F2.’s aggregate revenue differs from F2.’s by Rs. 5 Crore.
What can be said regarding the following two statements?
Statement I: F1. has the highest share in the S1 market.
Statement II: F2. has the highest share in the S2 market.
The table below presents the revenue (in million rupees) of four firms in three states. These firms, F1, F2., F3. And F4. are disguised in the table as A, B, C and D, in no particular order.
|
States |
Firm A |
Firm B |
Firm C |
Firm D |
|
S1 |
49 |
82 |
80 |
55 |
|
S2 |
69 |
72 |
70 |
65 |
|
S3 |
72 |
63 |
72 |
65 |
Further, it is known that:
In the state of S3, F3. has the highest market share.
F2.’s aggregate revenue differs from F2.’s by Rs. 5 Crore.
What can be said regarding the following two statements?
Statement I: F1. has the highest share in the S1 market.
Statement II: F2. has the highest share in the S2 market.
B is honest according to Statement (I) Atmost only one statement can be true as both give Aggressive and Honest as firm B.Firm B cannot have two names.
Upvote