 / Preparation Maths Probability
Normal Distribution is an essential concept in statistics and probability. It shows how data is spread around the mean value. It is also known as the Gaussian distribution or bell-shaped curve, which is symmetrical, the same on both sides. This distribution is based on two important parameters: mean (average) and standard deviation. Normal Distribution is a type of continuous probability distribution.
Gaussian Distribution is used in quality control, predictive modelling, natural phenomena, data analysis, hypothesis testing, and real-world datasets. This concept is used in science, economics, and engineering. Also, the empirical rule, z-score and standard normal distribution are the properties of normal curves.
Students who have a good command of the statistics and probability chapters can easily understand the topic. Normal Distribution is an important topic for board exams. Practice questions based on Normal distributions for better understanding. Students can also attempt NCERT solutions to practice for exams.
Also Read:
| NCERT Class 12 notes | |
| Class 12 Maths NCERT notes |
- What is Normal Distribution?
- Normal Distribution Formula
- Weightage of Normal Distribution:
- Importance of Normal Distribution (Gaussian Distribution)
- Properties of Normal Distribution
- Illustrative examples on Normal Distribution:
- FAQs on Normal Distribution
What is Normal Distribution?
In Mathematics, Under Probability theory, a normal distribution or a Gaussian distribution is a continuous probability distribution for a real random variable. The property of normal distribution lies under the probability density function. To understand this better, consider a probability random function, say, f(x). Here, x can be any random variable for that probability function, denoted by f. Now, determine the range between which the probability function will be represented. Let the range be x to x+kx.
f(x) ≥ 0 ∀ x ϵ (−∞,+∞)
And -∞∫+∞ f(x) = 1
Important Topics:
| NCERT Class 11 notes | |
| Class 11 Chemistry NCERT notes |
Normal Distribution Formula
The formula for the Normal distribution is as follows:
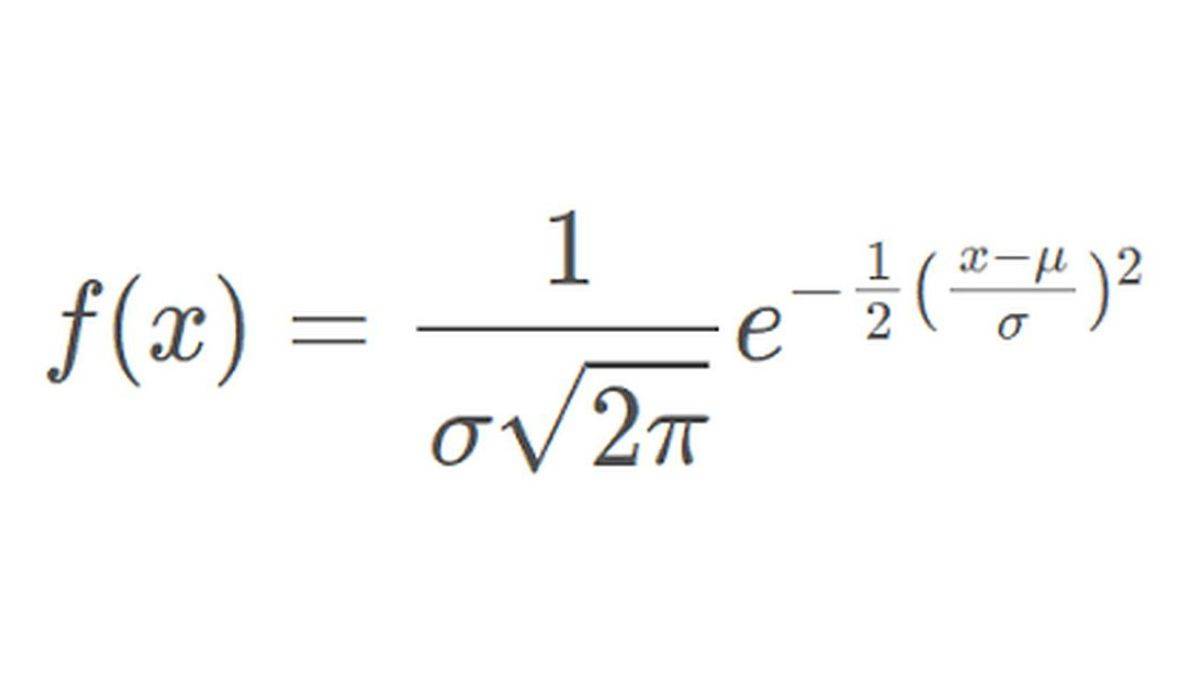
In the formula,
x is the variable
µ is the mean
σ is the standard deviation
Normal Distribution Curve
When understanding the normal distribution set, the random variables follow a particular pattern used to study and evaluate the values over a range of a sequence.
For example, When a doctor wants to estimate a particular patient’s height, he can evaluate it using a scale, with a specific range - between 0 and 6 feet.
But when talking about normal distribution, we don’t even bother about the range. It can extend from positive infinity to negative infinity, and we still obtain a smooth curve. The random set of variables is called continuous variables.

Weightage of Normal Distribution:
This topic is a part of the Probability of class XII. Normal Distribution normally does not come for the final examination, but the whole chapter has a weightage of 6-8 marks. The normal distribution is often asked as Multiple Choice Questions or 2- marks questions.
Importance of Normal Distribution (Gaussian Distribution)
Normal Distribution is important in statistics and data analysis. A factor proving the importance of normal distribution is mentioned below.
- Helps in prediction: Researchers use normal distribution to predict the population based on sample data.
- Easy to Work With: The bell-shaped curve of normal distribution is easy to understand. It is helpful in various areas such as engineering, economics, psychology, and biology.
- Common in real life: Normal distribution is used in studying human heights, exam scores, blood pressure, and measurement errors.
- Basis for Statistical Methods: Tests like the t-test, z-test, and confidence intervals are based on assumptions.
Properties of Normal Distribution
The properties of the normal distribution are mentioned below. These properties explain the behaviour, shape, and spread of data in a normal distribution.
- Bell-Shaped Curve: The graph of normal distribution is bell-shaped at the mean and symmetrical on both sides.
- Symmetry: The graph is perfectly symmetrical. This means both sides of the curve are equal.
- Mean-Median-Mode: All these are equal and located at the centre in a normal distribution.
- Empirical Rule (68-95-99.7 Rule): As per this rule
- 68% of the data is within 1 standard deviation.
- 95% of the data is within 2 standard deviations.
- 99.7% of the data is within 3 standard deviations.
Illustrative examples on Normal Distribution:
Question 1. X is a normally distributed variable with a mean of 30 and a standard deviation of 4. Find the P (x
Solution: To find- the area under the normal distribution curve. For x=40, the z value can be found out. Z= 2.5
Hence P(x
Question 2.A device is used to measure the speed of cars on a highway. The speed is normally distributed with a 90km/hr mean and a standard deviation of 10. What is the probability that the car picked was travelling at more than 100km/hr?
Solution: Let x be the random variable that represents the speed of cars. x has μ = 90 and σ = 10. We have to find the probability that x is higher than 100 or P(x > 100)
For x = 100 , z = (100 - 90) / 10 = 1
P(x > 90) = P(z > 1) = [total area] - [area to the left of z = 1]
= 1 - 0.8413 = 0.1587
Question 3. A machine produces an instrument with a particular life length. It has a normal distribution with a mean of 12 months. The standard deviation is for two months. What is the probability that instrument A made by this machine will last more than seven months?
Solution: P(7
= 0.493
FAQs on Normal Distribution
Q: What is Normal Distribution?
Q: What are the other names of Normal Distribution?
Q: What is the normal distribution curve like?
Q: What are the applications of Normal Distribution?
A: A normal distribution is the most important part in the probability distribution heading of statistical mathematics. It has applications in a vast range of sciences; from economics to business development and material sciences.
Maths Probability Exam
Student Forum
Other Topics under this Chapter
- Uniform Distribution
- Probability Overview
- Probability Density Function
- Non Parametric test
- Exponential Distribution
- Tree Diagram
- Probability Distribution
- Mutually Exclusive Events
- Conditional Probability
- Discrete Mathematics
- Collinear Points
- Poisson Distribution
- Game Theory
- Binomial Distribution
- Normal Distribution
Other Class 11th Maths Chapters
Popular Courses After 12th
Exams accepted
CA FoundationExams accepted
ICSI ExamExams accepted
BHU UET | GLAET | GD Goenka TestBachelor of Business Administration & Bachelor of Law
Exams accepted
CLAT | LSAT India | AIBEExams accepted
IPMAT | NMIMS - NPAT | SET
Exams accepted
BHU UET | KUK Entrance Exam | JMI Entrance ExamBachelor of Design in Animation (BDes)
Exams accepted
UCEED | NIFT Entrance Exam | NID Entrance ExamBA LLB (Bachelor of Arts + Bachelor of Laws)
Exams accepted
CLAT | AILET | LSAT IndiaBachelor of Journalism & Mass Communication (BJMC)
Exams accepted
LUACMAT | SRMHCAT | GD Goenka Test