 / Preparation Maths Statistics
Correlation and Regression are important topics in statistics. They are used to study the relationship between two or more variables. While both are used to understand relationships between variables, they are distinct statistical methods.
Correlation is used to study the strength and direction of two variables, while regression analyzes how a variable (dependent variable) is affected due to another variable (independent). This topic is important for board examiners. Students can go through the article and know more about correlation and regression in detail.
Also Read: NCERT Solution for Class 11 & 12
- What is Correlation?
- What is Regression?
- Difference Between Correlation and Regression
- Weightage of Correlation and Regression
- Illustrative examples on Correlation and Regression
- FAQs on Correlation and Regression
What is Correlation?
Correlation, a statistical concept, is used to calculate the value of the relationship between variables. A real-life example of what this technique calculates is the relationship between price and demand.
Types of Correlation
Correlation can be classified into the following categories.
- Positive and Negative Correlation
- Linear and Non-Linear Correlation
- Simple, Multiple and Partial Correlation
Techniques for measuring correlation
The various techniques used to measure correlation are :
- Scatter diagram
- Karl Pearson’s Coefficient of Correlation is represented by the formula

What is Regression?
Regression is a concept in statistics that is used to predict outcomes, understand relationships, and make data-driven decisions. Common types of regression include simple linear regression, multiple linear regression, logistic regression, and non-linear regression. The main uses of regression are prediction, trend analysis, and building relationships.
Difference Between Correlation and Regression
Below are the key differences between correlation and regression.
| Features | Correlation | Regression |
| Use | Analyze relationship | Prediction and estimation |
| Primary goal | Measure strength and direction | Predict the value of a variable |
| Direction | Symmetrical | One-way |
| Output | Correlation coefficient (r) | Regression equation (Y = a + bX) |
Weightage of Correlation and Regression
The concept of correlation and regression is introduced to the students of grade 11 as a part of statistics. The following concept generates high amounts of knowledge, especially in the field of data science. Regression is not evaluated while correlation is tested for 4-8 marks.
Illustrative examples on Correlation and Regression
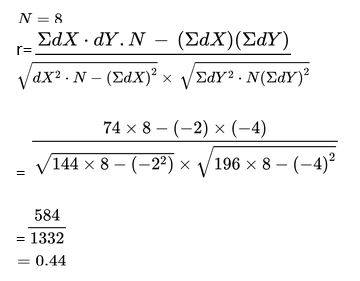
1. Calculate the correlation coefficient between the heights of fathers in inches (X) and their sons (Y)
| X |
65 |
66 |
57 |
67 |
68 |
69 |
70 |
72 |
| Y |
67 |
56 |
65 |
68 |
72 |
72 |
69 |
71 |
Solution.
| X |
dx(d from AM=67) |
dX² |
Y |
dY(d from AM=68) |
dY² |
dXdY |
| 65 |
-2 |
4 |
67 |
-1 |
1 |
2 |
| 66 |
-1 |
1 |
56 |
-12 |
144 |
12 |
| 57 |
-10 |
100 |
65 |
-3 |
9 |
30 |
| 67 |
0 |
0 |
68 |
0 |
0 |
0 |
| 68 |
+1 |
1 |
72 |
4 |
16 |
4 |
| 69 |
+2 |
4 |
72 |
4 |
16 |
8 |
| 70 |
+3 |
9 |
69 |
1 |
1 |
3 |
| 72 |
5 |
25 |
71 |
3 |
9 |
15 |
| ΣX = 534 |
ΣdX = -2 |
ΣdX² = 144 |
ΣY = 540 |
ΣdY = -4 |
ΣrdY² = 196 |
ΣdXdY=74 |
2. Calculate the correlation coefficient between X and Y and comment on their relationship.
| X |
-3 |
-2 |
-1 |
1 |
2 |
3 |
| Y |
9 |
4 |
1 |
1 |
4 |
9 |
Solution.
| X |
Y |
X² |
Y² |
XY |
| -3 |
9 |
9 |
81 |
-27 |
| -2 |
4 |
4 |
16 |
-8 |
| -1 |
1 |
1 |
1 |
-1 |
| 1 |
1 |
1 |
1 |
1 |
| 2 |
4 |
4 |
16 |
8 |
| 3 |
9 |
9 |
81 |
27 |
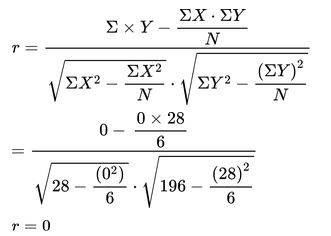
There is no linear correlation between the two variables, as X and Y are uncorrected.
3. Calculate the correlation coefficient between X and Y and comment on their relationship
| X |
1 |
3 |
4 |
5 |
7 |
8 |
| Y |
2 |
6 |
8 |
10 |
14 |
16 |
Solution.
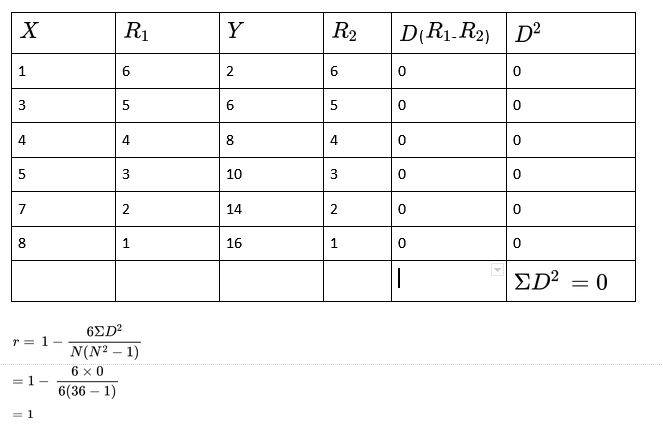
∴The two variables are perfectly positive correlated.
FAQs on Correlation and Regression
Q: When two variables move in the same direction, what is the nature of the correlation of two variables?
Q: What is the arithmetical representation of the Coefficient of correlation existing between -1 and +1?
Q: When is the method of rank correlation used for calculation?
Q: Define Regression
Q: Define the line of best fit.
Maths Statistics Exam
Student Forum
Other Class 11th Maths Chapters
Popular Courses After 12th
Exams accepted
CA FoundationExams accepted
ICSI ExamExams accepted
BHU UET | GLAET | GD Goenka TestBachelor of Business Administration & Bachelor of Law
Exams accepted
CLAT | LSAT India | AIBEExams accepted
IPMAT | NMIMS - NPAT | SET
Exams accepted
BHU UET | KUK Entrance Exam | JMI Entrance ExamBachelor of Design in Animation (BDes)
Exams accepted
UCEED | NIFT Entrance Exam | NID Entrance ExamBA LLB (Bachelor of Arts + Bachelor of Laws)
Exams accepted
CLAT | AILET | LSAT IndiaBachelor of Journalism & Mass Communication (BJMC)
Exams accepted
LUACMAT | SRMHCAT | GD Goenka Test