📄
Math Class 11 Notes
Want to revise 11th Math chapters quickly?
Glance at 11th Math quickly. / Preparation Maths Statistics
Measures of central tendency are the statistical measures that describe the center or typical value of a dataset. These provide a single value that tries to describe a dataset by identifying the central position within that set.
This concept has been introduced in the statistics chapter in class 11th. A number of entrance exams ask questions related to this for which we have shared an NCERT exercise on Statistics. Let us learn about different central tendency measures one by one.
Measurement of Central Tendency is used to describe a larger set of data by identifying a central value in that dataset and is sometimes also called summary statistics. There are 3 common measures of central tendency - Mean, Median and Mode which are considered to be accurate but in certain situations, some of them become more suitable to use than others.
The arithmetic mean is the average value of an entire data set and is among the most common measures of central tendency. Arithmetic mean can further be divided into the following -
The arithmetic mean is derived after adding the values in a data set together and dividing it by the total number of observations. In case of raw data, mean is calculated using below formula -

When some components in an equation contribute more weight to the overall equation, it is known as weighted arithmetic mean. To find the weighted mean in a given problem, we'll first multiply the numbers within the data set with weights and then add the results.

2. Median
Median is defined as a central value that divides a series of data into two halves, even as the data has been arranged in descending or ascending order of succession.
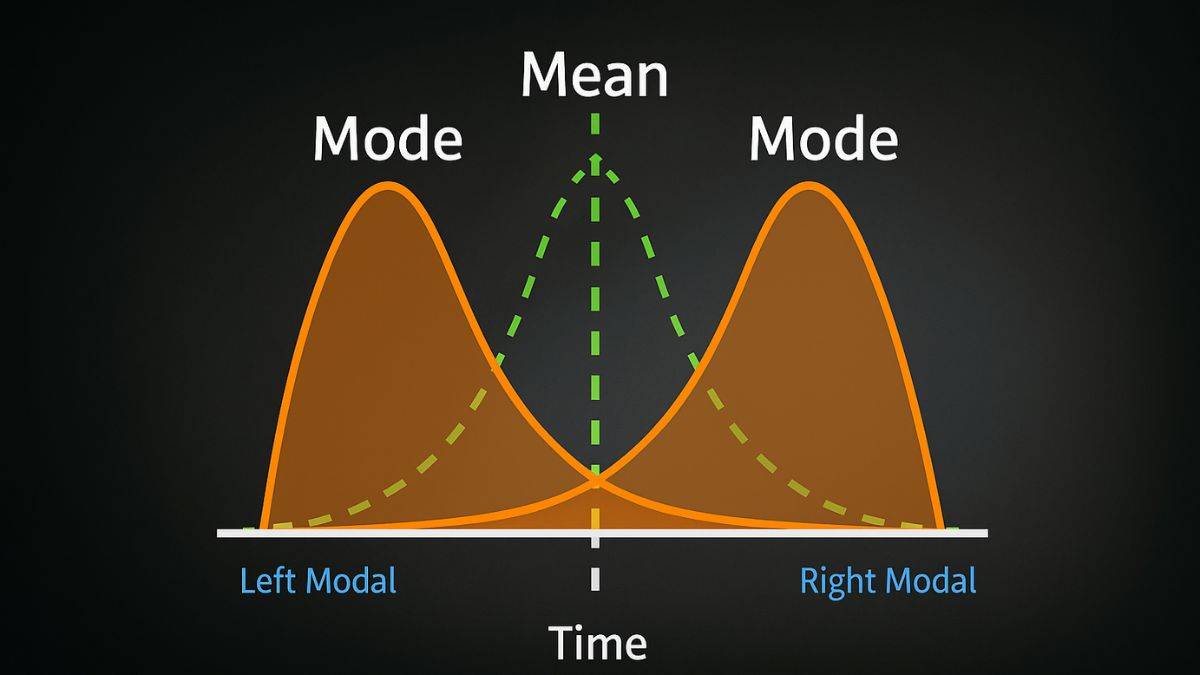
3. Mode
Mode is the measure that calculates the number of times a single value occurs in a distribution.
Math Class 11 Notes
Want to revise 11th Math chapters quickly?
Glance at 11th Math quickly.Math Class 12 Notes
12th Math chapters still pending?
Revise 12th Math Notes.NCERT Class 12 Notes
Want to quickly finish 12th class revision?
Read the 12th Topics.11th Physics Notes
11th Physics seems complex?
Go Through 11th Physics notes.Let us explore the three measures of central tendency, namely mean, median and mode.
It represents the average value of a dataset that can be calculated as the sum of all values in dataset divided by number of values. It is considered as arithemetic mean in general. Other measures of mean for finding central tendency include geometric mean, harmonic mean and weighted mean. IISER exam often ask questions based on this:
If all values in a dataset are the same, then geometric, arithmetic and harmonic mean values will all be same.
In case the data has variability, then mean value will differ. The following formula is used for calculating the mean value:
In a symmetric distribution of data, mean value is located accurately at centre. However, in the case of skewed continuous data distribution, extreme values in extended tail pull away the mean value from the centre. Mean should be mainly used for symmetric distributions.
It is the middle value of dataset where dataset is arranged in either ascending or descending order. In the case where dataset contains even number of values, median value of dataset will be determined by taking the mean of middle two values.
First, let us arrange them in ascending order, i.e. 5, 11, 15, 16, 18, 21, 24, 25, 34.
The number of observations is 9, i.e, an. odd number of observations
The middle value in this case will be position (9+1)/2 = 5
The 5th value in the sorted order is 18
This represents the frequently occurring value in dataset. In some cases, the dataset may contain multiple modes and in some cases, no mode might be there. Let us consider a dataset 6, 7, 8, 6, 9, 5
As we know, the mode represents the most common value of a dataset. In this case, the most frequently repeated value is 6.
Exams like JEE Main and IIT JAM ask questions that require using different measures of central tendency. Let us look at some examples as mentioned below.
1. A class 12th B, has 25 students who took an English test. Among them, 10 students had an average score of 80, while the other students had an average score of 60. What will be the average score of the whole class?
Solution. In the first step, we will multiply average score with number of students who had that score and then add them.
Thus:
80x10+ 60x15 = 800+900 = 1700
Number of observations = 25
1700/25 = 68
Ans: The average score of the class was 68.
2: Find the median of the following series-
5, 7, 6, 1, 8, 10, 12, 4, and 3.
Solution.
To find the median, we need to follow the steps mentioned below:
Step 1: Arranging the numbers in ascending order
= 1, 3, 4, 5, 6, 7, 8, 10, 12.
Step 2: Find the central value; hence, it becomes the median
Since 6 is the central value in the series, the median = 6.
3. Calculate the value of the modal worker family’s monthly income from the following data:
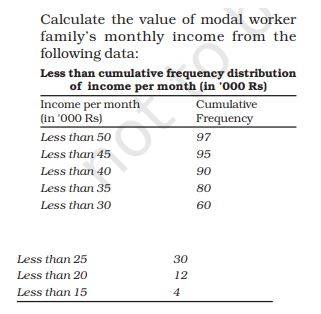
Solution.
Firstly, considering that the table is a cumulative frequency distribution, we will have to convert it into an exclusive series & an ordinary frequency table -
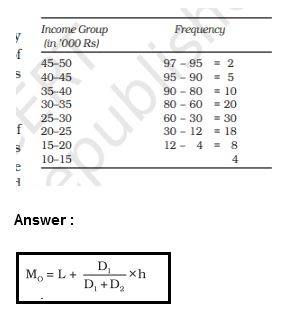
Hence, we derive the following from the above formula -
L = 25, D1 = (30 – 18) = 12, D2 = (30 – 20) = 10, h = 5
= 25+12/12+10x5
= Rs. 27.273
The following points highlight the advantages of different measures of central tendency. NEET entrance exam and CUET exam often ask questions that leverage the use case specific to one of the measures of central tendency.:
Just like a coin has two sides, each measure of central tendency has its own set of advantages and disadvantages. Knowing these is important from the GATE exam point of view. Let us take a look at each one of them.:
Let us discuss some of the important central tendency measures that are important for students of CBSE board:

Which is the most suitable average for qualitative measurement?
Median is considered to be the most suitable average for qualitative measurement. It divides an entire frequency distribution into two haves. This is especially useful for ordinal data where values represent categories with meaningful order. However, it is not necessarily a linear scale. The median gives a cental value which is less influenced by extreme values or outliers. This is important while dealing with qualitative data which may not be either symmetrically scaled or evenly distributed.
Which measure of central tendency is the most affected by extreme items or outliers of data?
Arithmetic mean is the measure of central tendency that is most affected by extreme items or outliers in the dataset. The reason behind this is since mean is calculated by summing up all the values and after that, it is divided by the number of values. Extreme values may disproprotionately impact the sum which in turn skews the mean and make it less represenative of dataset as whole.
Maths Statistics Exam
Exams accepted
CA Foundation
Exams accepted
ICSI Exam
Exams accepted
BHU UET | GLAET | GD Goenka Test
Bachelor of Business Administration & Bachelor of Law
Exams accepted
CLAT | LSAT India | AIBE
Exams accepted
IPMAT | NMIMS - NPAT | SET
Exams accepted
BHU UET | KUK Entrance Exam | JMI Entrance Exam
Bachelor of Design in Animation (BDes)
Exams accepted
UCEED | NIFT Entrance Exam | NID Entrance Exam
BA LLB (Bachelor of Arts + Bachelor of Laws)
Exams accepted
CLAT | AILET | LSAT India
Bachelor of Journalism & Mass Communication (BJMC)
Exams accepted
LUACMAT | SRMHCAT | GD Goenka Test