 / Preparation Maths Ncert Solutions class 11th
Class 11 Statistics NCERT Solutions deals with the concepts of statistics, which include the data collected for specific purposes. By analyzing and interpreting the data, we make decisions out on the data. To make a better interpretation from the data, we must have an idea of how much the data is bunched around a measure of central tendency and how the data are scattered. It also covers the concepts of variability and measures of central tendency.
NCERT Solutions for Class 11 Statistics covers key topics like Mean, Deviation, range, measures of dispersion, and variance and standard deviation. The well-structured solutions are created by the subject matter experts at Shiksha. It will help the students in improving their problem-solving skills, and in scoring good marks in the Class 11 exams, CBSE Board, and entrance exams like the JEE Main exam.
If you are looking for a go-to place for the NCERT solutions of Maths, Physics, and Chemistry of Class 11 and Class 12, you must check here. The solutions are in a step-by-step format to help students understand the concepts better.
- Quick Summary of Chapter 13 Statistics – Class 11 Maths
- Class 11 Math Statistics: Key Topics, Weightage
- Important Formulas of Class 11 Statistics NCERT Solutions
- Statistics Class 11 NCERT Solution PDF: Download Free PDF
- Class 11 Math Statistics Exercise 13.1 Solutions
- Class 11 Math Statistics Exercise 13.2 Solutions
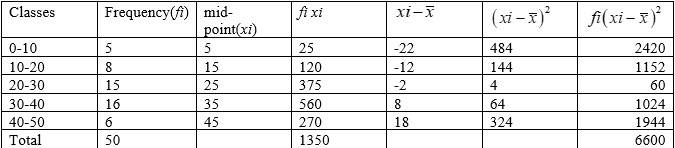
- Class 11 Math Statistics Exercise 13.3 Solutions
- Class 11 Math Statistics Miscellaneous Exercise Solutions
Quick Summary of Chapter 13 Statistics – Class 11 Maths
Find below the highlights of the Statistics Class 11 Maths:
- The Statistics Class 11 NCERT Solutions cover the concepts of measures of dispersion, mean deviation for ungrouped data, mean deviation for grouped data, variance, and standard deviation for ungrouped data.
- It also covers the variance and standard deviation of a discrete frequency distribution, the variance and standard deviation of a continuous frequency distribution, and a shortcut method to find variance and standard deviation.
- The chapter includes the mathematical representations for these concepts.
Students must find the free PDFs of all NCERT solutions of all chapters of Class 11 Maths here. They will also get the weightage information and the important topics through this link.
Class 11 Math Statistics: Key Topics, Weightage
In the NCERT Solutions Class 11 Statistics, students should focus on the mode, median, mean, variance, and standard deviation to have a better understanding of probability and statistics problems. See here the topics covered in this chapter:
| Exercise | Topics Covered |
|---|---|
| 13.1 | Introduction |
| 13.2 | Measures of Dispersion |
| 13.3 | Range |
| 13.4 | Mean Deviation |
| 13.5 | Variance and Standard Deviation |
Statistics Class 11 Weightage in JEE Mains
The Class 11 Statistics doesn't have a stand-alone and direct weightage in the JEE Mains exam. However, the concepts of this chapter are foundational for probability and statistics, which are part of the JEE Mains. To prepare well for JEE Mains exam, the students should also focus on the probability distributions, random variables, Bayes' theorem, and conditional probability.
More Links
| NCERT Class 11 Notes | Class 11 Maths NCERT Notes |
Important Formulas of Class 11 Statistics NCERT Solutions
Important Formulae for Class 11 Math Statistics for CBSE and Competitive Exams
Measures of Dispersion
- Range
- Mean Deviation
- About Mean
- About Median
- About Mean
- Variance & Standard Deviation
- Variance:
- Standard Deviation:
- Shortcut Formula:
- Variance:
- Coefficient of Variation (C.V.)
Statistics Class 11 NCERT Solution PDF: Download Free PDF
Students also get the link to the free Statistics Class 11 PDF below, which they must download to practice the NCERT exercises related to this chapter. The PDF is created by the experts in Shiksha for students to deepen their understanding of concepts. It can help students to score well in the CBSE Board exams and competitive exams like JEE Main.
Chapter 5 Statistics Class 11 NCERT Solutions: Download PDF for Free
Class 11 Math Statistics Exercise 13.1 Solutions
Class 11 Math Statistics Exercise 13.1 focuses on fundamental concepts such as measures of dispersion, mean deviation for grouped and ungrouped data, variance, and standard deviation. Ex 13.1 Statistics solutions will contain well-explained answers to all 12 questions of the exercise. Students can check the solutions below.
Class 11 Maths Statistics exercise 15.1 SolutionQ1. Find the mean deviation about the mean for the data in Exercises 1 and 2. 4, 7, 8, 9, 10, 12, 13, 17 |
| A.1. Mean of the given observation is.
Deviation of the respective observation about the mean i.e., are 4–10,7–10,8–10,9–10,10–10,12–10,13–10,17–10 =6,-3,-2,-1,0,2,3,7 The absolute value of the deviation i.e., are 6,3,2,1,0,2,3,7. Therefore, the required mean deviation about the mean is
= 3. |
| Q2. 38, 70, 48, 40, 42, 55, 63, 46, 54, 44 | ||||||||||||||||||||||
| A.2. Mean of the given observation is.
So,
Therefore, the required mean deviation about the mean is
= 8.4 |
| Q3. Find the mean deviation about the median for the data in Exercises 3 and 4. 13, 17, 16, 14, 11, 13, 10, 16, 11, 18, 12, 17 |
||||||||||||||||||||||||||
| A.3. Arranging the data in ascending order we get, 10,11,1112,13,13,14,16,16,17,17,18 As n=12, even So, median is the mean of and observation.
So, deviation of respective observation about the median. are
Therefore the mean deviation about the mean is
|
| Q4. 36, 72, 46, 42, 60, 45, 53, 46, 51, 49 | ||||||||||||||||||||||
| A.4. Arranging the given data in ascending order we get, 36,42,45,46,46,49,51,53,60,72 As n = 10 (even)
= 47.5
M.D. (M)
|
| Q5. Find the mean deviation about the mean for the data in Exercises 5 and 6. xi 5 10 15 20 25 fi 7 4 6 3 5 |
|||||||||||||||||||||||||||||||||||
| A.5. From the given data we have,
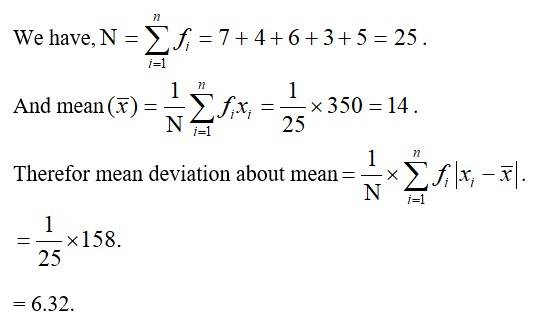
|
| Q6. xi 10 30 50 70 90 fi 4 24 28 16 8 |
|||||||||||||||||||||||||||||||||||
| A.6. From the given data we tabulate the following.
We have, 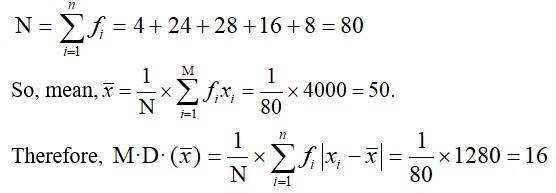
|
| Q7. Find the mean deviation about the median for the data in Exercises 7 and 8. xi 5 7 9 10 12 15 fi 8 6 2 2 2 6 |
||||||||||||||||||||||||||||||||||||||||
| A.7. From the given data we cantabulate the following.
Now, N=26 which is even. So, Median is the mean of 13th and 14th observation. Both of these observations lie in the cumulative frequency 14 for which corresponding observation is 7. 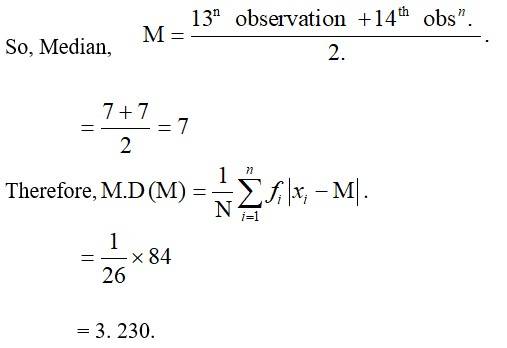
|
| Q8. xi 15 21 27 30 35 fi 3 5 6 7 8 |
|||||||||||||||||||||||||||||||||||
| A.8. From the given data we can tabulate the following.
Here N = 29 which is odd. 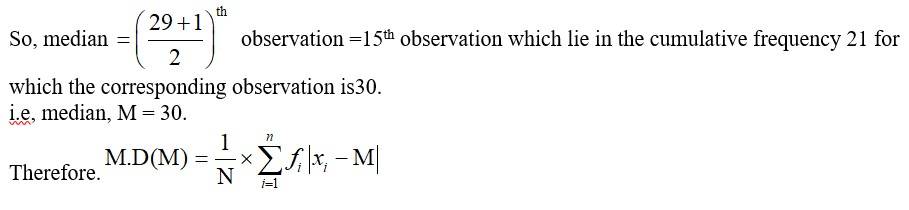
= 1/29 × 148
= 5. 10 |
| Q9. Find the mean deviation about the mean for the data in Exercises 9 and 10.
|
||||||||||||||||||||||||||||||||||||||||||||||||||||||||||||
| A.9. From the given data we cantabulate the following.
|
| Q10.
|
||||||||||||||||||||||||||||||||||||||||||||||||||||||||
| A.10. From the given data we can insulate the following. Take the assumed meana=120 and h=10
|
| Q11.Find the mean deviation about median for the following data :
|
||||||||||||||||||||||||||||||||||||||||||||||||
| A.11. From the given data we can tabulate the following.
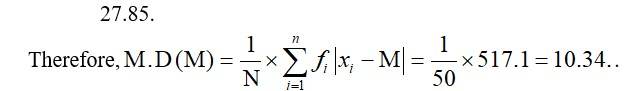
|
| Q12.Calculate the mean deviation about median age for the age distribution of 100 persons given below:
[Hint Convert the given data into continuous frequency distribution by subtracting 0.5 from the lower limit and adding 0.5 to the upper limit of each class interval] |
||||||||||||||||||||||||||||||||||||||||||||||||||||||||||||
| A.12. The given data is made'continuous by subtracting 0.5 from the lower limit and adding 0.5 to the upper limit of each class. So, we cam tabulate as.
|

Commonly asked questions
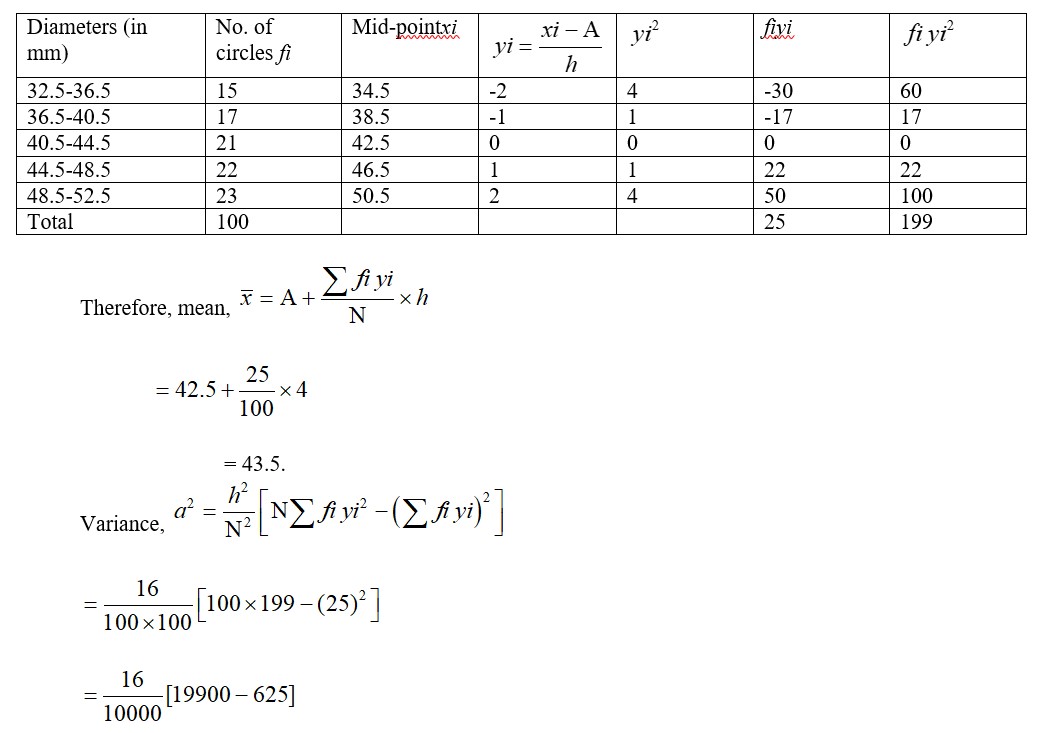
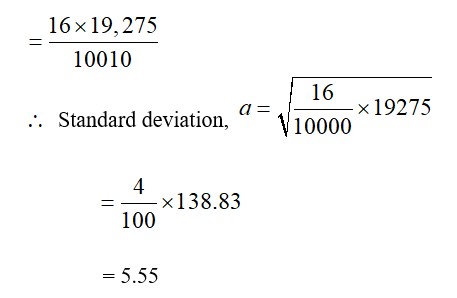
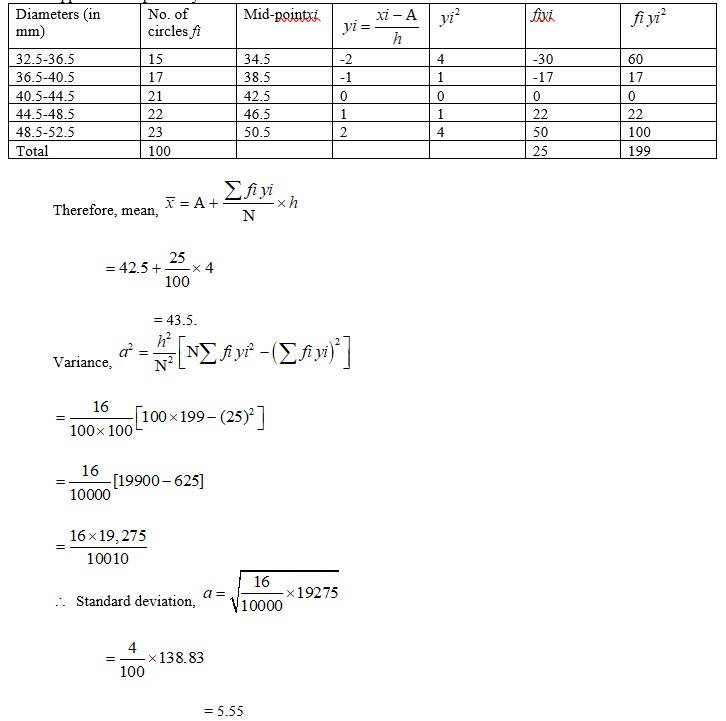
22. The diameters of circles (in mm) drawn in a design are given below:
|
Diameters |
33-36 |
37-40 |
41-44 |
45-48 |
49-52 |
|
No. of circles |
15 |
17 |
21 |
22 |
25 |
Calculate the standard deviation and mean diameter of the circles.
[ Hint First make the data continuous by making the classes as 32.5-36.5, 36.5-40.5, 40.5-44.5, 44.5 - 48.5, 48.5 - 52.5 and then proceed.]
22. The given data is converted into continuous frequency duration by subtracting and adding 0.5 from lower and upper limit respectively. Lit the assumed mean be A=42.5 and h=4
33. The mean and standard deviation of marks obtained by 50 students of a class in three subjects, Mathematics, Physics and Chemistry are given below:
Subject Mathematics Physics Chemistry
Mean 42 32 40.9
Standard 12 15 20
deviation
Which of the three subjects shows the highest variability in marks and which shows the lowest?
33. C.V in mathematics =
C.V in Physics =
C.V in chemistry =
Chemistry has the highest variability and mathematics has the lowest variability.
Class 11 Maths Statistics exercise 13.2 Solution
13. Find the mean and variance for each of the data in Exercies 13 to 17.
6, 7, 10, 12, 13, 4, 8, 12
13. The given data can be tabulated as.

we have,
mean,
So, variance,
14. First n natural numbers
14. We know that,
Sum of first'n ' natural no
So, mean,
So, Variance,
So,

And
Putting (2), (3) and (4) in (1) we get,
10.
|
Height in cms |
95-105 |
105-115 |
115-125 |
125-135 |
135-145 |
145-155 |
|
Number of persons |
9 |
13 |
26 |
30 |
12 |
10 |
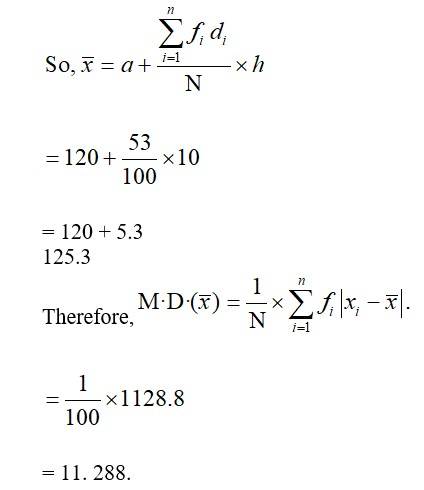
10. From the given data we can insulate the following.
Take the assumed mean a=120 and h=10
Heigts in cm. | No. of boys fi | Mid-pointsxi |  | fidi | |xi - x? | | fi |xi - x? | |
95-105 | 9 | 100 | -2 | -18 | 25.3 | 227.7 |
105-115 | 13 | 110 | -1 | -13 | 15.3 | 198.9 |
115-125 | 26 | 120 | 0 | 5.3 | 137.8 | |
125-135 | 30 | 130 | 1 | 30 | 4.7 | 141 |
135-145 | 12 | 140 | 2 | 24 | 14.7 | 176.4 |
145-155 | 10 | 150 | 3 | 30 | 24.7 | 247 |
Total | 100 |
| 53 |
| 1128.8 |
12.Calculate the mean deviation about median age for the age distribution of 100 persons given below:
|
Age (in years) |
16-20 |
21-25 |
26-30 |
31-35 |
36-40 |
41-45 |
46-50 |
51-55 |
|
Number |
5 |
6 |
12 |
14 |
26 |
12 |
16 |
9 |
[Hint Convert the given data into continuous frequency distribution by subtracting 0.5 from the lower limit and adding 0.5 to the upper limit of each class interval]
12. The given data is made'continuous by subtracting 0.5 from the lower limit and adding 0.5 to the upper limit of each class. So, we cam tabulate as.
Age | number fi | c.f. | mid-point xi | |xi - M| | fi |xi - M| |
15.5-20.5 | 5 | 5 | 18 | 20 | 100 |
20.5-25.5 | 6 | 11 | 23 | 15 | 90 |
25.5-30.5 | 12 | 23 | 28 | 10 | 120 |
30.5-35.5 | 14 | 37 | 33 | 5 | 70 |
35.5-40.5 | 26 | 63 | 38 | 0 | 0 |
40.5-45.5 | 12 | 75 | 43 | 5 | 60 |
45.5-50.5 | 16 | 91 | 48 | 10 | 160 |
50.5-55.5 | 9 | 100 | 53 | 15 | 135 |
Total | 100 |
|
|
| 735 |
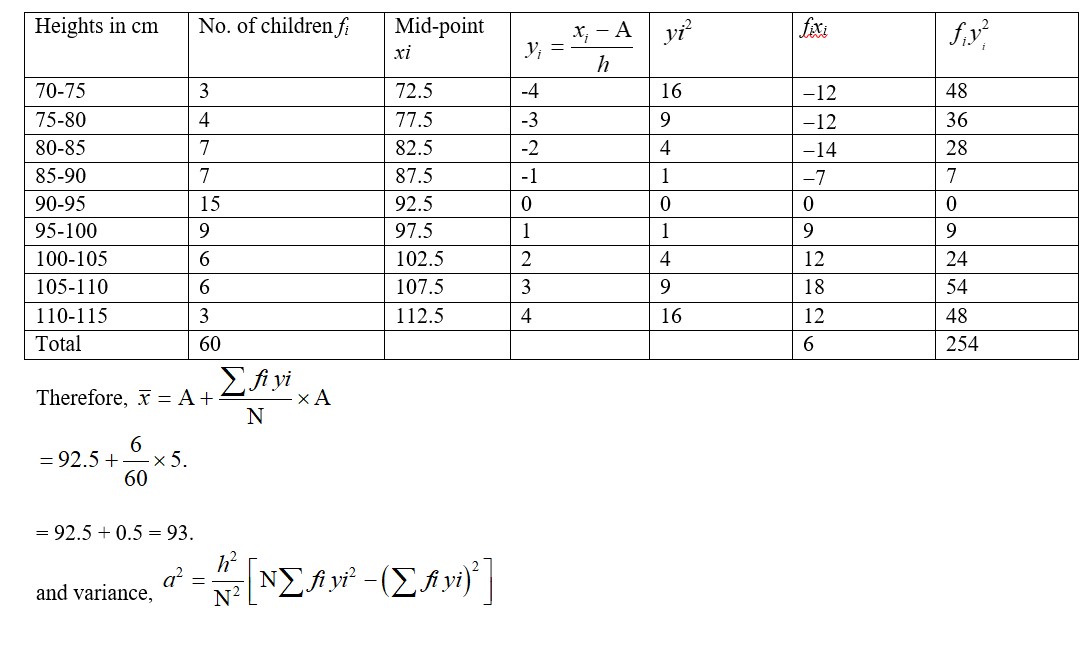
21. Find the mean, variance and standard deviation using short-cut method
|
Height in cms |
70-75 |
75-80 |
80-85 |
85-90 |
90-95 |
95-100 |
100-125 |
105-110 |
110-115 |
|
Frequencies |
3 |
4 |
7 |
7 |
15 |
9 |
6 |
6 |
3 |
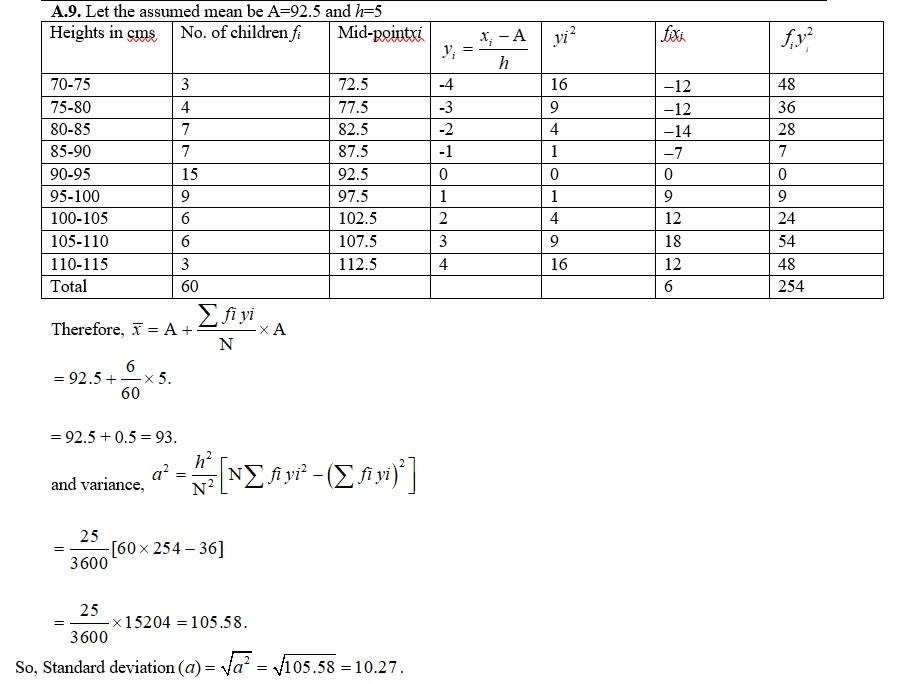
21. Let the assumed mean be A=92.5 and h=5
Class 11 Maths Statistics exercise 15.1 Solution
1. Find the mean deviation about the mean for the data in Exercises 1 and 2.
4, 7, 8, 9, 10, 12, 13, 17
1. Mean of the given observation is.
Deviation of the respective observation about the mean i.e., are 4–10,7–10,8–10,9–10,10–10,12–10,13–10,17–10
=6, -3, -2, -1,0,2,3,7
The absolute value of the deviation i.e., are 6,3,2,1,0,2,3,7.
Therefore, the required mean deviation about the mean is
= 3.
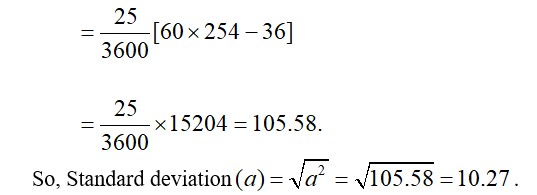
18.Find the mean and standard deviation using short-cut method.
|
xi |
60 |
61 |
62 |
63 |
64 |
65 |
66 |
67 |
68 |
|
fi |
2 |
1 |
12 |
29 |
25 |
12 |
10 |
4 |
5 |
18. Let the assumed mean be A=64 and it the width, h=1.
3. Find the mean deviation about the median for the data in Exercises 3 and 4.
13, 17, 16, 14, 11, 13, 10, 16, 11, 18, 12, 17
3. Arranging the data in ascending order we get,
10,11,1112,13,13,14,16,16,17,17,18
As n=12, even
So, median is the mean of and observation.
So, deviation of respective observation about the median. are
xi | 10 | 11 | 11 | 12 | 13 | 13 | 14 | 16 | 16 | 17 | 17 | 18 |
| |xi - M| | 3.5 | 2.5 | 2.5 | 1.5 | 0.5 | 0.5 | 0.5 | 2.5 | 2.5 | 3.5 | 3.5 | 4.5 |
Therefore the mean deviation about the mean is
5. Find the mean deviation about the mean for the data in Exercises 5 and 6.
xi 5 10 15 20 25
fi 7 4 6 3 5
5. From the given data we have,
xi | fi | xi fi | |xi - 14| | fi |xi - 14| |
5 | 7 | 35 | 9 | 63 |
10 | 4 | 40 | 4 | 16 |
15 | 6 | 90 | 1 | 6 |
20 | 3 | 60 | 6 | 18 |
25 | 5 | 125 | 11 | 55 |
Total - | 25 | 350 |
| 158 |
8. xi 15 21 27 30 35
fi 3 5 6 7 8
8. From the given data we can tabulate the following.
xi | fi | c.f. | |xi - M| | fi |xi - M| |
15 | 3 | 3 | 15 | 45 |
21 | 5 | 8 | 9 | 45 |
27 | 6 | 14 | 3 | 18 |
30 | 7 | 21 | 0 | 0 |
35 | 8 | 29 | 5 | 40 |
Total | 29 |
|
| 148 |
Here N = 29 which is odd.

= 5. 10
15. First 10 multiples of 3
15. We have, first 10 multiples of 3=3,6,9,12,15,18,21,24,27,30.
So,
We can now tabulate the given data as following.
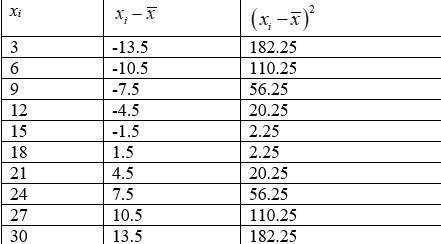

Therefore, variance,
= 74.25.
Class 11 Maths Statistics exercise 13.3 Solution
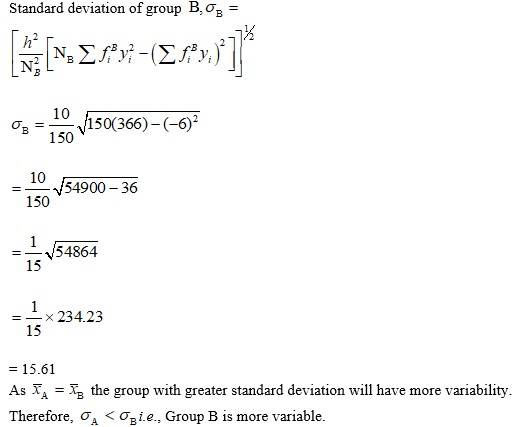
23. From the data given below state which group is more variable, A or B?
|
Marks |
10-20 |
20-30 |
30-40 |
40-50 |
50-60 |
60-70 |
70-80 |
|
Group A |
9 |
17 |
32 |
33 |
40 |
10 |
9 |
|
Group B |
10 |
20 |
30 |
25 |
43 |
15 |
7 |
23. Let the assumed mean be A=45 and h=10. Then we can tabulate the given data as following.
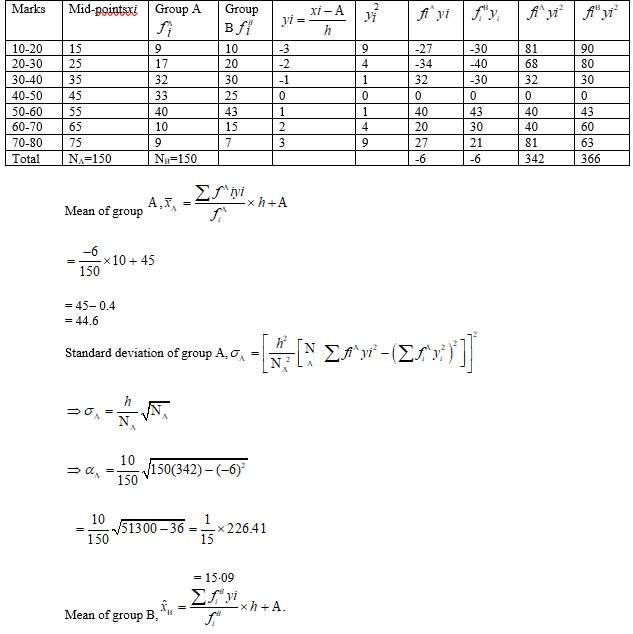
= 44.6
25. An analysis of monthly wages paid to workers in two firms A and B, belonging to the same industry, gives the following results:
Firm A Firm B
No. of wage earners 586 648
Mean of monthly wages ? 5253 ?5253
Variance of the distribution 100 121
of wages
(i) Which firm A or B pays larger amount as monthly wages?
(ii) Which firm, A or B, shows greater variability in individual wages?
(i) The number of wage earner in firm A, nA=586. Mean monthly wages of firm

Total no of were canner in firm B.
Total monthly mages in firm. B = ?5253 × nB
=? 5253 × 586
=? 34, 03, 944
Firm B pays larger amount of monthly wages.
(ii) Since both the firm A and B has same mean monthly wages the firm with greater standard duration i.e, greater variance will have more variability in individual ways. Therefore, firm B will have more variability in individual wages.
27. The sum and sum of squares corresponding to length x (in cm) and weight y (in gm) of 50 plant products are given below:
Which is more varying, the length or weight?
27. Given, n=50.
So,

9. Find the mean deviation about the mean for the data in Exercises 9 and 10.
|
Income per day` |
0-100 |
100-200 |
200-300 |
300-400 |
400-500 |
500-600 |
600-700 |
700-800 |
|
Number of persons |
4 |
8 |
9 |
10 |
7 |
5 |
4 |
3 |
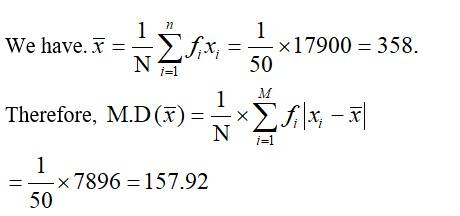
9. From the given data we cantabulate the following.
Income per day in ' | Number of person fi | Mid points xi | fi xi | |xi - x? | | fi |xi - x? | |
01-00 | 4 | 50 | 200 | 308 | 1232 |
100-200 | 8 | 150 | 1200 | 208 | 1664 |
200-300 | 9 | 250 | 2250 | 108 | 972 |
300-400 | 10 | 350 | 3500 | 8 | 80 |
400-500 | 7 | 450 | 3150 | 92 | 644 |
500-600 | 5 | 550 | 2750 | 192 | 960 |
600-700 | 4 | 650 | 2600 | 292 | 1168 |
700-800 | 3 | 750 | 2250 | 392 | 1176 |
Total | 50 |
| 17900 |
| 7896 |
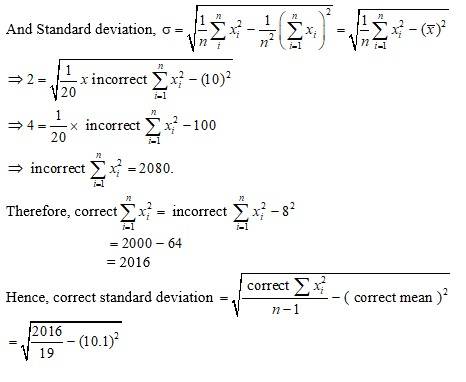
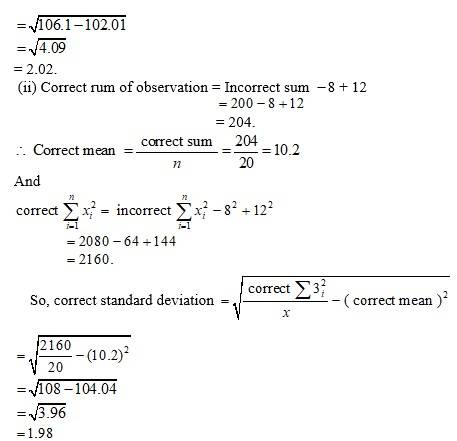
32. The mean and standard deviation of 20 observations are found to be 10 and 2, respectively. On rechecking, it was found that an observation 8 was incorrect. Calculate the correct mean and standard deviation in each of the following cases:
(i) If wrong item is omitted.
(ii) If it is replaced by 12.
32. (i) Given, n = 20.
Incorrect mean
Incorrect standard deviation
We know that,
So, incorrect sum of observation = 200.
correct sum of observation =200 – 8 = 192
And correct mean
2. 38, 70, 48, 40, 42, 55, 63, 46, 54, 44
2. Mean of the given observation is.
So,
xi | 38 | 10 | 48 | 40 | 42 | 55 | 63 | 46 | 54 | 44 |
| |xi - 50| | 12 | 20 | 2 | 10 | 8 | 5 | 13 | 4 | 6 |
Therefore, the required mean deviation about the mean is
= 8.4
4. 36, 72, 46, 42, 60, 45, 53, 46, 51, 49
4. Arranging the given data in ascending order we get,
36,42,45,46,46,49,51,53,60,72
As n = 10 (even)
= 47.5
| xi | 36 | 42 | 45 | 46 | 46 | 49 | 51 | 53 | 60 | 72 |
| |xi - M| | 11.5 | 5.5 | 2.5 | 1.5 | 1.5 | 1.5 | 3.5 | 5.5 | 12.5 | 24.5 |
M.D. (M)
6. xi 10 30 50 70 90
fi 4 24 28 16 8
6. From the given data we tabulate the following.
xi | fi | xifi | |xi - x? | | fi |xi - x? | |
10 | 4 | 4 | 40 | 160 |
30 | 24 | 720 | 20 | 480 |
50 | 28 | 1400 | 0 | 0 |
70 | 16 | 1120 | 20 | 320 |
90 | 8 | 720 | 40 | 320 |
Total | 80 | 4000 |
| 1280 |
We have,

7. Find the mean deviation about the median for the data in Exercises 7 and 8.
xi 5 7 9 10 12 15
fi 8 6 2 2 2 6
7. From the given data we cantabulate the following.
xi | fi | Cumulative frequency C.f. | |xi - M| | fi |xi - M| |
5 | 8 | 8 | 2 | 16 |
7 | 6 | 14 | 0 | 0 |
9 | 2 | 16 | 2 | 4 |
10 | 2 | 18 | 3 | 6 |
12 | 2 | 20 | 5 | 10 |
15. | 6 | 26 | 8 | 48 |
Total | 26 |
|
| 84 |
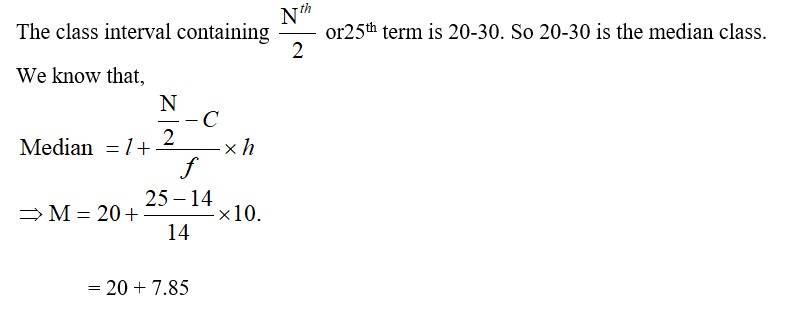
Now, N=26 which is even.
So, Median is the mean of 13th and 14th observation. Both of these observations lie in the cumulative frequency 14 for which corresponding observation is 7.
11.Find the mean deviation about median for the following data :
|
Marks |
0-10 |
10-20 |
20-30 |
30-40 |
40-50 |
50-60 |
|
Number of girls |
6 |
8 |
14 |
16 |
4 |
2 |
11. From the given data we can tabulate the following.
Marks | No. of girls (fi) | c.f. | mid-pointsxi | |xi - M| | fi |xi - M| |
0-10 | 6 | 6 | 5 | 22.85 | 137.1 |
10-20 | 8 | 14 | 15 | 12.85 | 102.8 |
20-30 | 14 | 28 | 35 | 2.85 | 39.9 |
30-40 | 16 | 44 | 35 | 7.15 | 114.4 |
40-50 | 4 | 48 | 45 | 17.15 | 68.6 |
50-60 | 2 | 50 | 55 | 27.15 | 54.3 |
Total | 50 |
|
|
| 517.1 |
16.
|
xi |
6 |
10 |
14 |
18 |
24 |
28 |
30 |
|
fi |
2 |
4 |
7 |
12 |
8 |
4 |
3 |
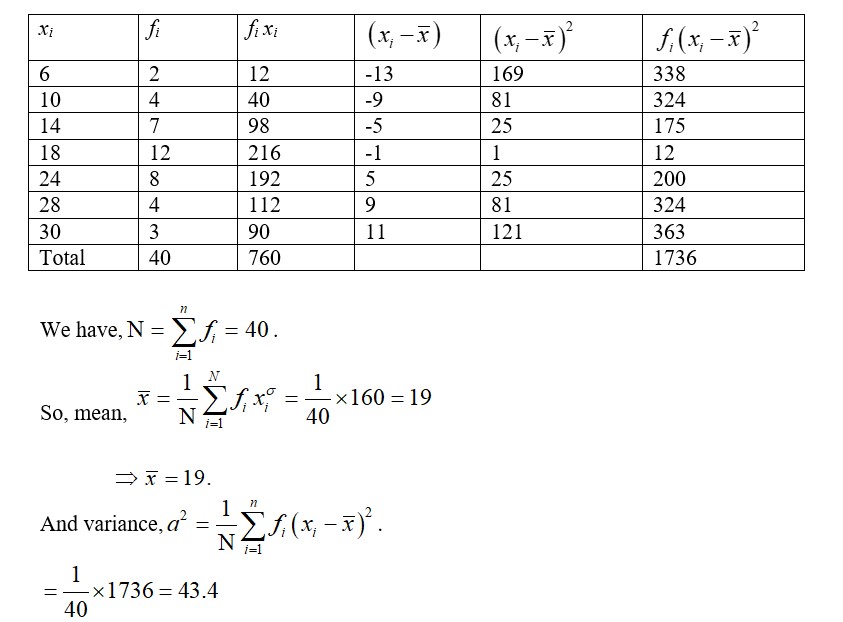
16. The given data can be tabulated as follow.
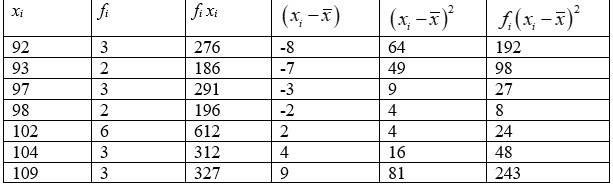
17.
|
xi |
92 |
93 |
97 |
98 |
102 |
104 |
109 |
|
fi |
3 |
2 |
3 |
2 |
6 |
3 |
3 |
17. The given data can be tabulated as follow
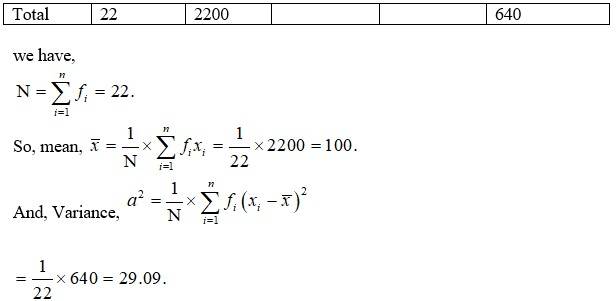
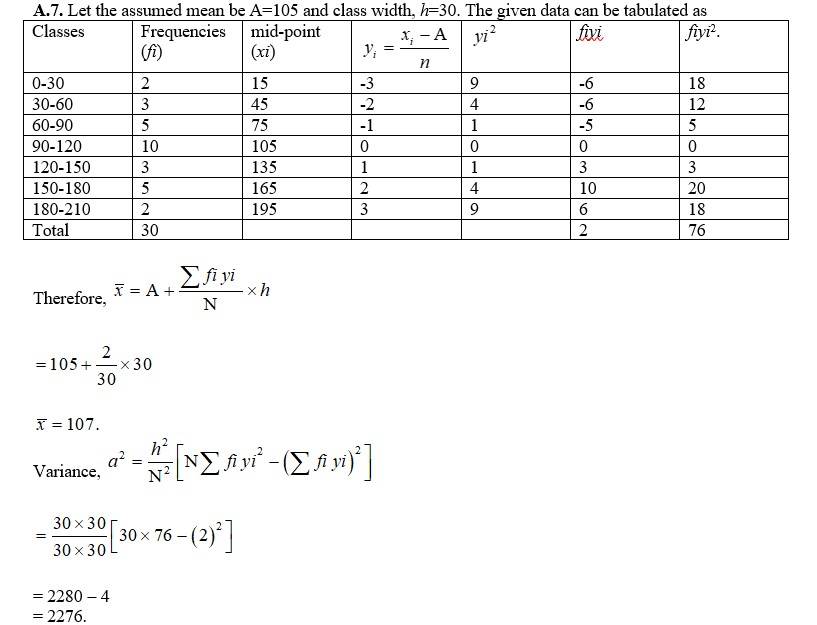
19. Find the mean and variance for the following frequency distributions in Exercises 19 and 20.
|
Classes |
0-30 |
30-60 |
60-90 |
90-120 |
120-150 |
150-180 |
180-210 |
|
Frequencies |
2 |
3 |
5 |
10 |
3 |
5 |
2 |
19. Let the assumed mean be A=105 and class width, h=30. The given data can be tabulated as
= 2280 - 4
= 2276.
20.
|
Classes |
0-10 |
10-20 |
20-30 |
30-40 |
40-50 |
|
Frequencies |
5 |
8 |
15 |
16 |
6 |
20.
We have, .
So, mean,

= 132.
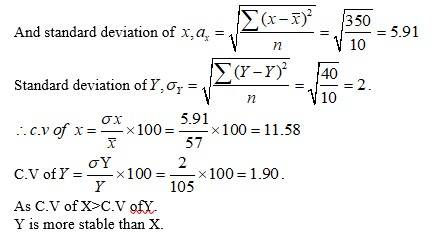
24. From the prices of shares X and Y below, find out which is more stable in value:
|
X |
35 |
54 |
52 |
53 |
56 |
58 |
52 |
50 |
51 |
49 |
|
Y |
108 |
107 |
105 |
105 |
106 |
107 |
104 |
103 |
104 |
101 |
24. We can tabulate the given data as follows.
Total =
Mean of
Mean of .
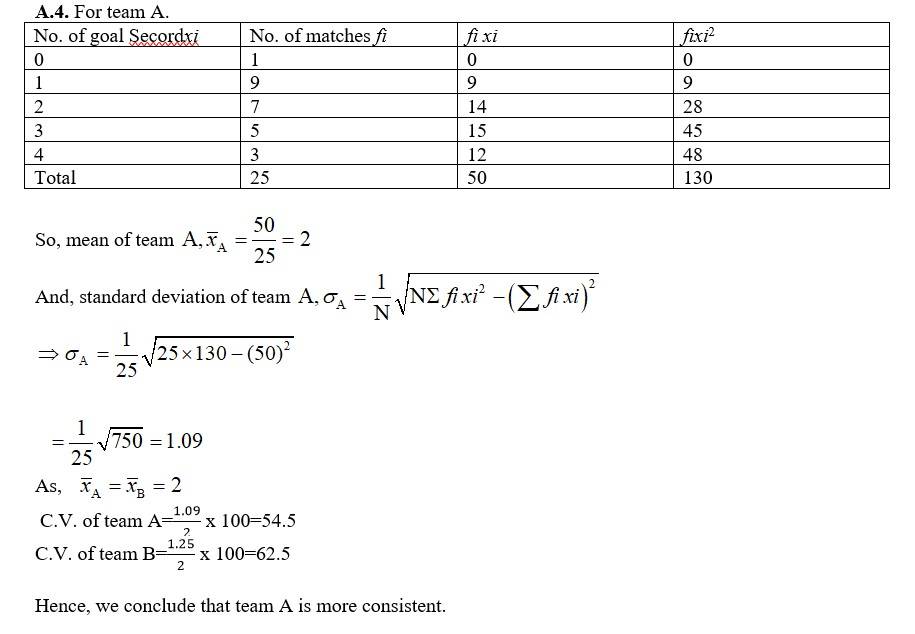
26. The following is the record of goals scored by team A in a football session:
|
No. of goals scored |
0 |
1 |
2 |
3 |
4 |
|
No. of matches |
1 |
9 |
7 |
5 |
3 |
For the team B, mean number of goals scored per match was 2 with a standard deviation 1.25 goals. Find which team may be considered more consistent?
26. For team A.
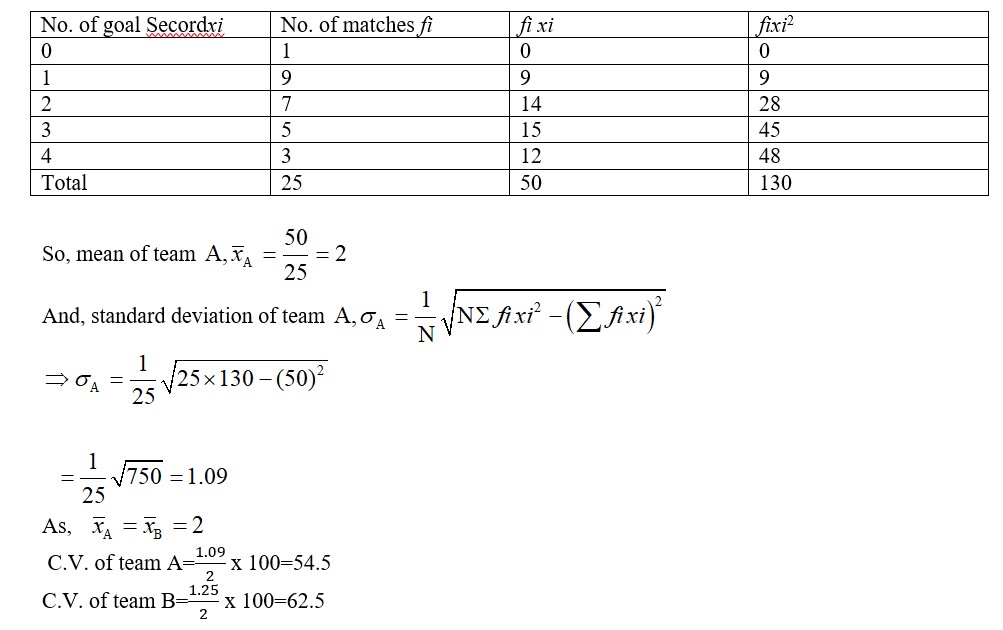
Hence, we conclude that team A is more consistent.
30. The mean and standard deviation of six observations are 8 and 4, respectively. If each observation is multiplied by 3, find the new mean and new standard deviation of the resulting observations.
30. Let 'x' be the given observations with n = 6.
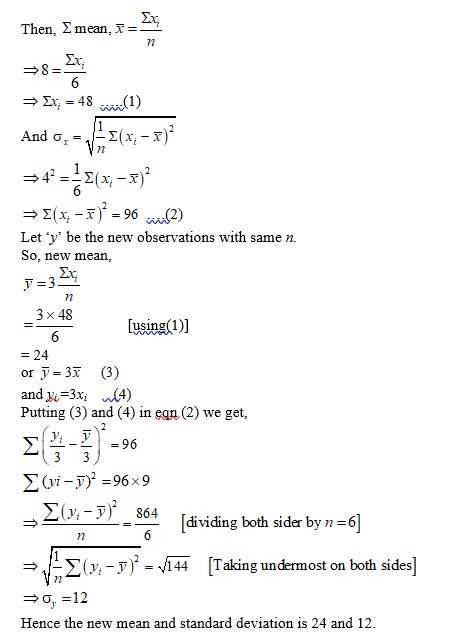
31. Given that is the mean and σ2 is the variance of n observations x1, x2, ...,xn. Prove that the mean and variance of the observations ax1, ax2, ax3, ...., axn are a and a2 σ2, respectively, (a ≠ 0).
31. For n observations x1, x2,……., xn .
We have mean =
and variance =
Let yi be the new observations with same n.
So, yi = axi (3)
Now mean,
So
And, putting (3) and (4) in (2) we get,
Hence, the mean and variance of ax1, ax2, ……, axn are and a2 σ2 .
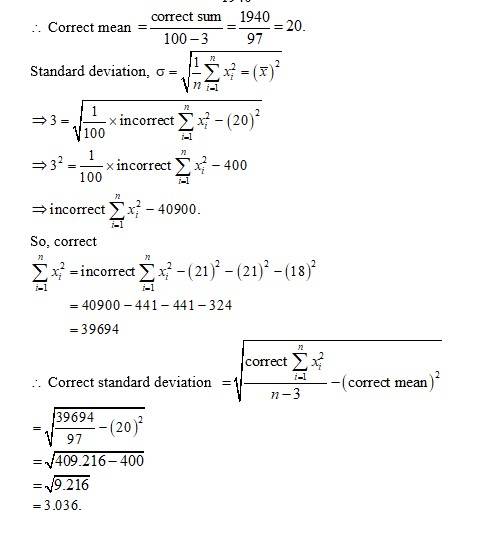
34. The mean and standard deviation of a group of 100 observations were found to be 20 and 3, respectively. Later on it was found that three observations were incorrect, which were recorded as 21, 21 and 18. Find the mean and standard deviation if the incorrect observations are omitted.
34. Given, n = 100.
incorrect mean ( ) = 20.
incorrect standard deviation (σ) = 3
We know that,
So, incorrect sum of observation = 2000
Correct sum of observation
= 1940
Class 11 Math Statistics Exercise 13.2 Solutions
Class 11 Math Statistics Exercise 13.2 deals with more advanced concepts, such as measures of dispersion, variance, and standard deviation, which helps students understand how data is distributed around the mean and median. Statistics Exercise 13.2 contains a total of 10 short and long answer questions. Students can check the solution of all the question below;
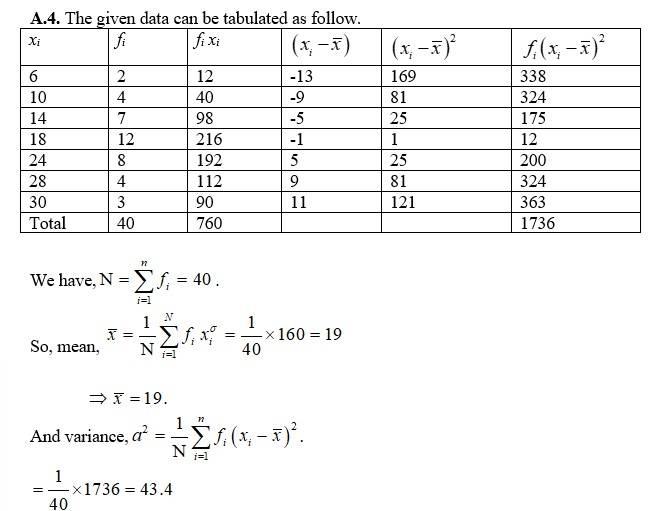
Class 11 Maths Statistics exercise 13.2 SolutionQ1. Find the mean and variance for each of the data in Exercies 1 to 5. 6, 7, 10, 12, 13, 4, 8, 12 |
|
A.1. The given data can be tabulated as. 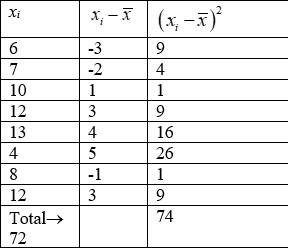
we have, mean, So, variance,
|
| Q2. First n natural numbers |
| A.2. We know that, Sum of first'n ' natural no So, mean,
So, Variance,
So, 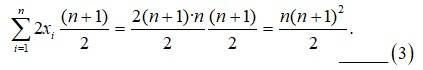
And Putting (2), (3) and (4) in (1) we get,
|
| Q3. First 10 multiples of 3 |
| A.3. We have, first 10 multiples of 3=3,6,9,12,15,18,21,24,27,30. So, We can now tabulate the given data as following.

Therefore, variance,
= 74.25. |
| Q4.
|
||||||||||||||||
|
| Q5.
|
||||||||||||||||
| A.5. The given data can be tabulated as follow
|
| Q6.Find the mean and standard deviation using short-cut method.
|
||||||||||||||||||||
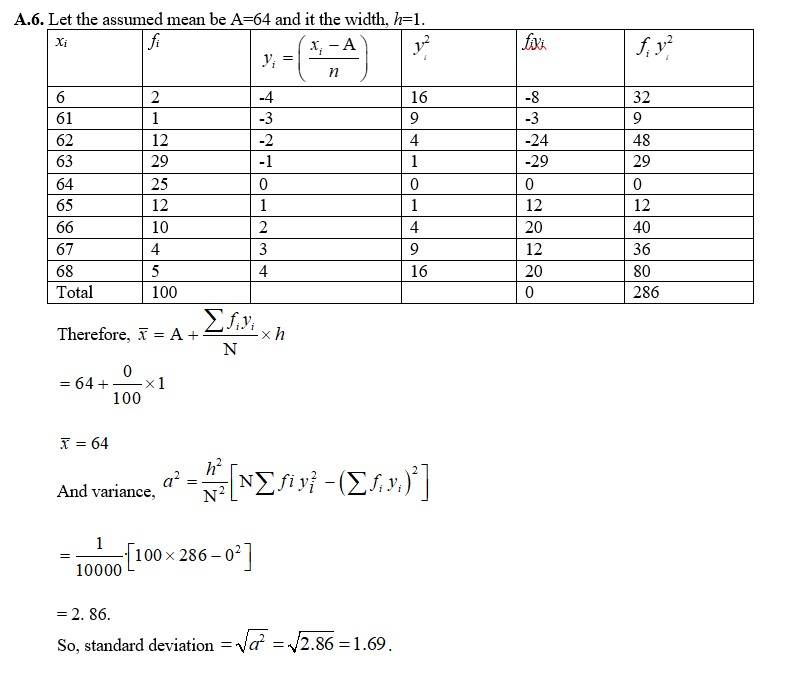
|
| Q7. Find the mean and variance for the following frequency distributions in Exercises7 and 8.
|
||||||||||||||||
|
| Q8.
|
||||||||||||
| A8.
We have, . So, mean, 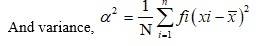
= 132. |
| Q9. Find the mean, variance and standard deviation using short-cut method
|
||||||||||||||||||||
|
| Q10. The diameters of circles (in mm) drawn in a design are given below:
Calculate the standard deviation and mean diameter of the circles. [ Hint First make the data continuous by making the classes as 32.5-36.5, 36.5-40.5, 40.5-44.5, 44.5 - 48.5, 48.5 - 52.5 and then proceed.] |
||||||||||||
| A.10. The given data is converted into continuous frequency duration by subtracting and adding 0.5 from lower and upper limit respectively. Lit the assumed mean be A=42.5 and h=4
|
Class 11 Math Statistics Exercise 13.3 Solutions
Class 11 Math Exercise 13.3 of Statistics focuses on problems related to big or grouped data set, such as finding the mean deviation with mode or median, finding standard deviation with mean or median, and more. There are 5 questions in Exercise 13.3, which is deleted in the latest CBSE syllabus. Students can find the solution below;
Class 11 Maths Statistics exercise 13.3 SolutionQ1. From the data given below state which group is more variable, A or B?
|
||||||||||||||||||||||||
| A.1. Let the assumed mean be A=45 and h=10. Then we can tabulate the given data as following.
= 44.6
|
| Q2. From the prices of shares X and Y below, find out which is more stable in value:
|
||||||||||||||||||||||
| A.2. We can tabulate the given data as follows.
Total = Mean of Mean of .
|
| Q3. An analysis of monthly wages paid to workers in two firms A and B, belonging to the same industry, gives the following results: Firm A Firm B No. of wage earners 586 648 Mean of monthly wages ₹ 5253 ₹5253 Variance of the distribution 100 121 of wages (i) Which firm A or B pays larger amount as monthly wages? (ii) Which firm, A or B, shows greater variability in individual wages? |
| A.3. (i) The number of wage earner in firm A, nA=586. Mean monthly wages of firm 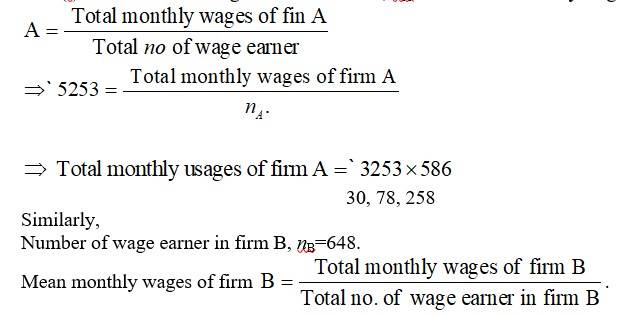
Total no of were canner in firm B. Total monthly mages in firm. B = ₹5253 × nB = ₹ 5253 × 586 ₹ 34, 03, 944 Firm B pays larger amount of monthly wages. (ii) Since both the firm A and B has same mean monthly wages the firm with greater standard duration i.e, greater variance will have more variability in individual ways. Therefore, firm B will have more variability in individual wages. |
| Q4. The following is the record of goals scored by team A in a football session:
For the team B, mean number of goals scored per match was 2 with a standard deviation 1.25 goals. Find which team may be considered more consistent? |
||||||||||||
|
| Q5. The sum and sum of squares corresponding to length x (in cm) and weight y (ingm) of 50 plant products are given below:
Which is more varying, the length or weight? |
| A.5. Give, n=50.
So, 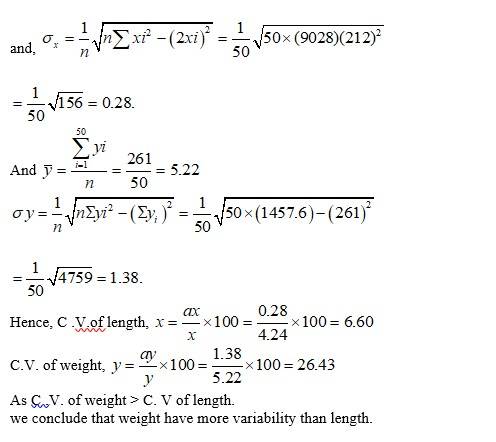
|
Class 11 Math Statistics Miscellaneous Exercise Solutions
Explore exams which ask questions on Maths Ncert Solutions class 11th
Select your preferred stream
Maths Ncert Solutions class 11th Exam
Student Forum
Other Similar chapters for you
- Binomial Theorem
- Probability
- Statistics
- Mathematical Reasoning
- Limits and Derivatives
- Introduction to Three Dimensional Geometry
- Conic Sections
- Straight Lines
- Sequences and Series
- NCERT Maths 11th
- Permutations and Combinations
- Linear Inequalities
- Complex Numbers and Quadratic Equations
- Principle of Mathematical Induction
- Trigonometric Functions
Popular Courses After 12th
Exams accepted
CA FoundationExams accepted
ICSI ExamExams accepted
BHU UET | GLAET | GD Goenka TestBachelor of Business Administration & Bachelor of Law
Exams accepted
CLAT | LSAT India | AIBEExams accepted
IPMAT | NMIMS - NPAT | SET
Exams accepted
BHU UET | KUK Entrance Exam | JMI Entrance ExamBachelor of Design in Animation (BDes)
Exams accepted
UCEED | NIFT Entrance Exam | NID Entrance ExamBA LLB (Bachelor of Arts + Bachelor of Laws)
Exams accepted
CLAT | AILET | LSAT IndiaBachelor of Journalism & Mass Communication (BJMC)
Exams accepted
LUACMAT | SRMHCAT | GD Goenka Test