Bivariate Analysis: Uses, Types, Pros & Cons

Statistics 2021 ( Maths Statistics )

Jaya Sharma
Updated on Jul 28, 2025 01:31 IST

By Jaya Sharma, Assistant Manager - Content

Bivariate analysis is a statistical analysis related to the study of relationships between two variables. The aim is to understand the association or correlation between two variables.

bivariate analysis

The analysis determines whether a relationship exists between variables. It also analyses the strength and direction of the relationship. The statistics chapter covers this topic in detail for students who are currently in class 12th. Questions related to this type of analysis are often asked in CBSE board which makes it essential for students to understand it in detail.

Table of content
  • What is Bivariate Analysis?
  • What are the Different Types of Bivariate Analysis?
  • What is Correlation Coefficient Formula in Bivariate Analysis?
  • What are the Advantages of Bivariate Analysis?
  • What are the disadvantages of Bivariate analysis?
  • Illustrated Examples on Bivariate Analysis
  • FAQs on Bivariate Analysis
View More
Maths Statistics Logo

What is Bivariate Analysis?

The bivariate examination is expressed to be an investigation of any simultaneous connection between two factors or properties. This investigation investigates the relationship between two factors, as well as the profundity of this relationship, to sort out any inconsistencies between the two factors and any reasons for this distinction. A portion of the models are rate tables, disperse plot, and so on. Take a look at NCERT excercise of Statistics chapter to understand the type of questions asked related to bivariate examination. Let us move further.

For the investigation, it is important to perceive bivariate information first. Typically, the information contains two estimations, for example, X and Y. For every estimation, the bivariate information can be deciphered as the pair (X, Y ). These factors are frequently called bivariate straightforward arbitrary examples (SRS). We can indicate these factors as (X1, Y1), (X2, Y2),… ..,(Xn, Yn). The bivariate information can be spoken to in a table as demonstrated beneath :

Observations

X-Variable

Y-Variable

1

10

5

2

5

4

3

6

3

4

8

2

5

4

-5


Maths Statistics Logo

What are the Different Types of Bivariate Analysis?

Types of bivariate analysis are categorised based on the nature of the variables involved. Let us take a look at these:

1. Numerical and Numerical

Within this categorisation, there are further sub-categories:

  • Scatter plots: This is a graphical representation that displays the relationship between two continuous variables. Every point on the plot represents an observation. This is very popular topic from IIT JAM test point of view.
  • Correlation analysis: It measures the strength and direction of linear relationship between two numerical variables through correlation coefficients such as Spearman's rank correlation, Kendall's tay and Pearson's R.
  • Simple Linear Regression: This models the relationship between dependent variable and independent variable by fitting a linear equation to observed data.

2. Categorical and Categorical:

Let us know about the different types of bivariate analysis that are within this category:

  • Contingency tables: This is also known as cross tabulations, and these tables provide the frequency distribution of two categorical variables.
  • Chi-square test: This is a type of statistical test that determines whether there is a significant association between two categorical variables.
  • Cramer's V: This is a measure of association between two nominal variables that gives a value between 0 and 1.

3. Numerical and Categorical:

Let us take a look at the subcategories within this:

  • Box plots: It visualises the distribution of numerical variables across different categories that show median, quartiles and potential outliers,
  • T-tests: It compares the means of a numerical variable between two groups that are defined by a categorical variable.
  • ANOVA: This extends the t-test for comparing means against three or more groups.
  • Bar Plots With Error Bar: It displays the mean/median values of a numerical variable for every category with error bars representing variability.

4. Ordinal and Ordinal

The following are different types of bivariate analysis in this category:

  • Spearman's Rank Correlation: This measures the strength and direction of association between two ranked variables.
  • Kendall's Tau: This is another measure of rank correlation, which is suitable for ordinal data.
Maths Statistics Logo

What is Correlation Coefficient Formula in Bivariate Analysis?

JEE Main entrance exam often asks questions related to this coefficient. It is a statistical measure that quantifies both strength and direction of a relation between 2 continuous variables. The pearson correlation coefficient is denoted as r. This particular correlation coefficient between two variables X and Y will be:
  r = n ( X Y ) ( X ) ( Y ) [ n X 2 X 2 ] [ n Y 2 Y 2 ]

  • n is the number of observations or data points
  • ∑XY is the sum of product of the paired scores
  • ∑X and ∑Y is the sum of the scores of X and Y 
  • X 2 and Y 2 is the sum of squared scores of X and Y

Let us understand more about correlation coefficient in bivariate analysis:

  • Value of r ranges from -1 to 1.
  • If r is 1, it reflects a perfectly positive linear relationship. As one variable increases, the other one will increase proportionally.
  • In case r is -1, it reflects a perfect negative linear relationship. As one variable increases, the other one will decrease proportionally.
  • If r is 0, there is no linear relationship between the variables. Other types of relationships may exist.
  • The closer the proximity of r is to 1 and -1, the stronger the linear relationship between the two variables.
  • The sign of r represents the direction of the relationship, i.e. positive or negative.
Maths Statistics Logo

What are the Advantages of Bivariate Analysis?

The following points highlight the advantages of bivariate analysis. NEET exam aspirants must learn about them :

  • Understandable: Bivariate analysis is simple to understand and easy to implement. This focuses solely on two variables, due to which it becomes easier to interpret the results as compared to complex multivariate analyses.
  • Identifying relationship: A bivariate analysis helps to identify and quantify the relationship between two variables. This reveals patterns, trends and associations that otherwise may not be apparent when looked at each variable in isolation.
  • Direction and strength: This analysis determines the direction (either positive or negative) as well as the strength of the relationship between two variables.
  • Hypothesis testing: This allows researchers to test the hypotheses about the relationship between 2 variables.
  • Visualisation: Bivariate analysis can be easily visualised using line graphs, bar charts and scatter plots, which makes it easy to communicate findings to a broader audience.
  • Preliminary analysis: This is a good starting point for complex analysis. Researchers are able to build advanced models that include multiple variables by understanding the relationship between pairs of variables.
  • Decision making: Bivariate analysis can aid in decision-making processes. Businesses may use it for understanding the relationship between advertising spending and sales revenue.
  • Data exploration: For data analysts, it is useful for the exploratory phase of data analysis. This helps in identifying the potential areas of both interest and concern that require further investigation.
Maths Statistics Logo

What are the disadvantages of Bivariate analysis?

While bivariate analysis has multiple advantages, it has its own set of limitations mentioned below. CUET exam aspirants must take a look at these:

  • Limited scope: It only examines the relationship between two variables at a time. This can overlook the complexity among multiple variables in real-world scenarios.
  • Ignores influence: This does not take into account the influence of other variables that may impact the relationship being studied. This leads to misleading conclusions when a third variable impacts both variables under consideration.
  • Assumption of linearity: Many bivariate analysis techniques, including Pearson correlation, assume a linear relationship between variables. In case the relationship is non-linear, these methods will not record the true nature of the association.
  • No causality: This identifies the associations between variables. However, it cannot establish causality. Determining the cause-and-effect relationship requires rigorous experimental designs and additional analysis techniques.
  • Data requirements: Certain bivariate analysis methods have specific data requirements, including normally distributed data or interval/ratio measurement level. If requirements are not fulfilled, results may become invalid or even misleading.
Maths Statistics Logo

Illustrated Examples on Bivariate Analysis

Let us take a look at some important questions that may be asked in the GATE entrance exam:

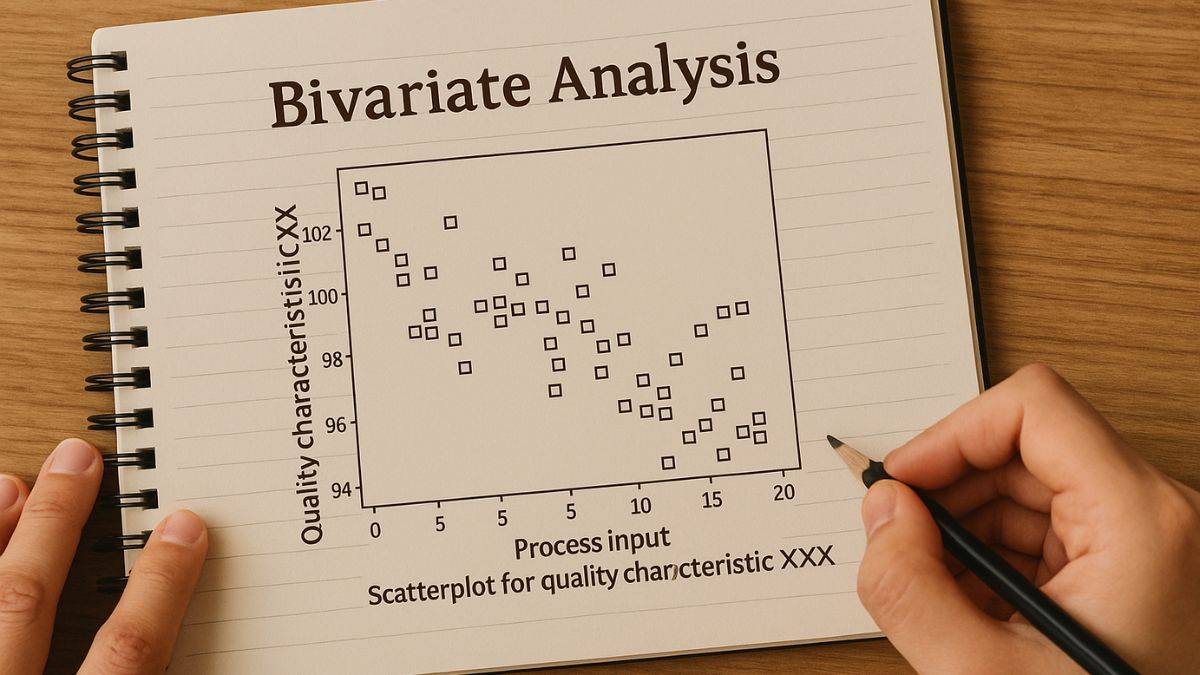
1. What type of graphs are used to depict the bivariate analysis?

Solution.

Bivariate information is investigated utilising the scatterplot of Y against X, giving a visual image of the information's relationship.

2. What do you mean by bivariate frequency distribution?

Solution.
A dispersion demonstrating every conceivable blend of two straight out factors as per their noticed recurrence

3. What is data?

Solution.

Information is plain reality, typically crude numbers. Think about an accounting page brimming with numbers with no significant depiction. Altogether, for these numbers to become data, they should be deciphered to have meaning.

Maths Statistics Logo

FAQs on Bivariate Analysis

Q: What do you understand by the term bivariate?

A: Of, relating to, or involving two variables, a bivariate frequency distribution.

Q: What are some examples of bivariate analysis?

A: Information for two factors (normally two sorts of related information). Model: Ice cream deals versus the temperature on that day. The two factors are Ice Cream Sales and Temperature.

Q: What is multivariate analysis?

A: Bivariate examination sees two combined informational collections, contemplating whether a relationship exists between them. Multivariate investigation utilises at least two factors and breaks down which, assuming any, are corresponded with a particular result. The objective in the last case is to figure out which factors impact or cause the result.

Q: Can we say that correlation is a bivariate analysis?

A: Bivariate investigations are directed to decide if a factual affiliation exists between two factors, the level of affiliation on the off chance that one does exist, and whether one variable might be anticipated from another.

Q: What do you mean by bivariate function?

A: Bivariate capacity, a component of two factors. Bivariate polynomial, a polynomial of two indeterminates.
qna

Maths Statistics Exam

Student Forum

chatAnything you would want to ask experts?
Write here...