📄
Math Class 11 Notes
Not sure if you are well prepared for exams?
Revise 11th Math Topics. / Preparation Maths Statistics
Statistics is a field in which data are collected, structured, processed, interpreted, and displayed. It is traditional to start with a sample data or statistical model in the application of statistics on research, commercial or societal issues. The T-test table is another statistical measure that determines whether there is a significant difference between means of two groups.
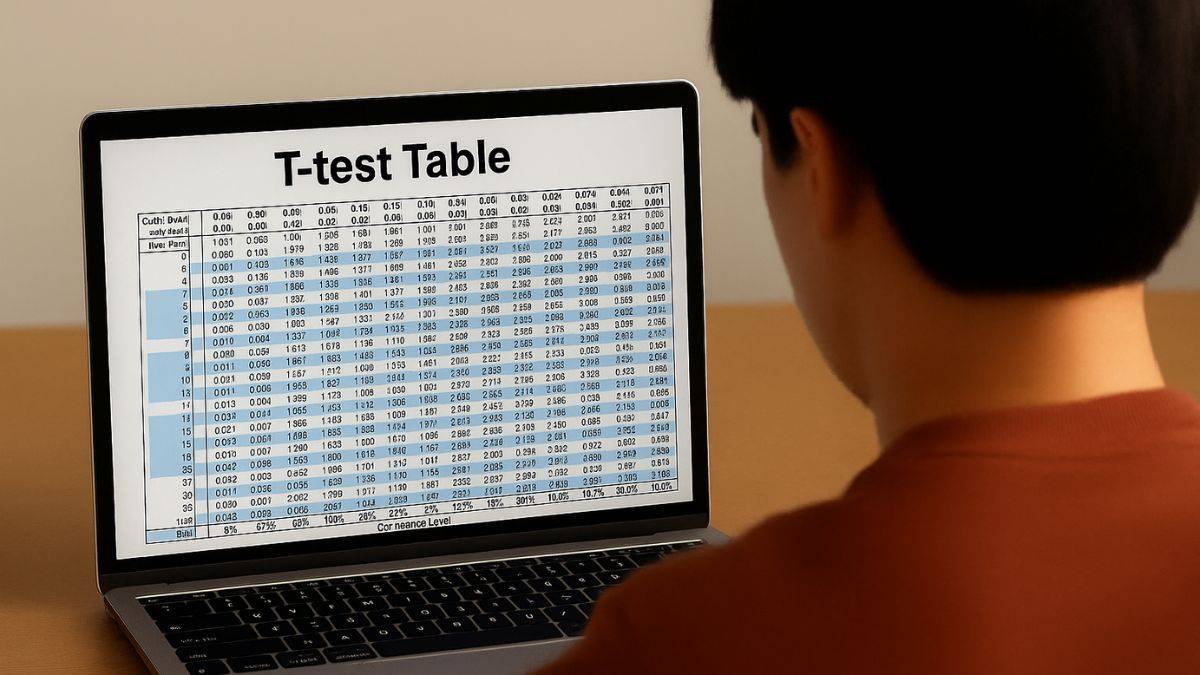
This is commonly used in hypothesis testing for comparing the sample mean to a known value or for comparing the means of two samples. The results of a t-test are presented in a t-test table. The statistics chapter's NCERT excercise includes questions on this topic, which students should at least check once.
A t-test can be represented in statistics as a predictive hypothesis test, where the test statistic follows the Student’s t-distribution if a null hypothesis is formed. Therefore, here we use the t-test table. The approaches of two observation groups are evaluated in paired T-test. Each group should obtain the observations randomly. Therefore, it is the protocol and not other variables that are the explanation for the difference in response.
The T-test is used for creating observations regarding a known sample before and after an event has occurred. Such that, in the case of two samples, observations from both these samples are paired with each other for using T-test effectively with precision. In the statistics chapter, this has been discussed in further detail.
Math Class 11 Notes
Not sure if you are well prepared for exams?
Revise 11th Math Topics.Math Class 12 Notes
CBSE board exams causing worry?
Check 12th Math Notes.NCERT Class 12 Notes
Want to be ahead of others?
Go Through 12th Class Notes.11th NCERT Notes
11th class subjects too difficult?
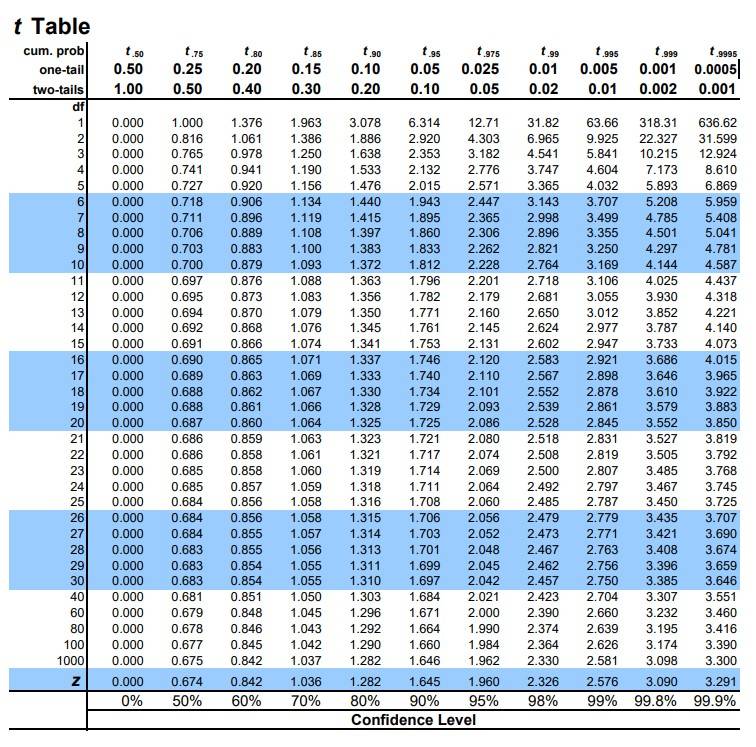
Prepare 11th Class Chapters.The T-Test table is used to identify the ratio for t-statistics and to evaluate the proportions combined with z-scores. Moreover, the probability of t-values can also be deciphered from the t-distribution table for a given value. Therefore, the probability thus obtained gives the area between two t-distribution ordinates, infinity and a given value. NEET entrance exam students must be well-aware of creating T-test table. The significant values for the probabilities of the t-distribution, α to the degrees of freedom(df), are established with the help of a T-Test table. Below, we have attached T-Test tables for both one tail and two tails.
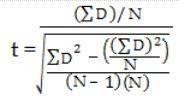
The formula for independent two-sample t-test is
Here,
are means of 2 groups
n₁ and n₂ are sizes of 2 groups
is pooled variance which is calculated as
are variances of 2 groups
The t-test is used in the following scenarios:
Let us take a look at some of the important questions related to t-test for the IIT JAM exam and the IISER examination:
1. Calculate t-test for the following data.

Solution.

Therefore, the required t-test value is -2.74. Thus, we can reject the null hypothesis for this value.
2. There are two sets: (2,7,8,9) and (4,3,2,1). Calculate t-test for the same.
Solution.

Therefore, the required t-test value is 2.36
3. Calculate t-test for the following data.
| A |
B |
|---|---|
| 45 |
34 |
| 38 |
22 |
| 52 |
15 |
| 48 |
27 |
| 25 |
37 |
| 39 |
41 |
| 51 |
24 |
| 46 |
19 |
| 55 |
26 |
| 46 |
36 |
Solution.
Therefore, the required t-test value is 4.27
Let us take a look at some important FAQs related to the T-test that students must be well aware of when they plan to take the 12th CBSE board exam:

What is the Z distribution and Chi-squared distribution?
Z distribution and Chi-Squared are some of the most popular distribution patterns of probability, and it is vital to recognise the variations between them and when to use the distribution pattern. A Z table is of no use when the operation revolves around a smaller sample size. On the other hand, the distribution of a sum of independent regular k squares in standard normal variables is the chi-square distribution of k degrees of freedom. The tests are used for the independence of two variables in an incident table and to assess the observable data for
Maths Statistics Exam
Exams accepted
CA Foundation
Exams accepted
ICSI Exam
Exams accepted
BHU UET | GLAET | GD Goenka Test
Bachelor of Business Administration & Bachelor of Law
Exams accepted
CLAT | LSAT India | AIBE
Exams accepted
IPMAT | NMIMS - NPAT | SET
Exams accepted
BHU UET | KUK Entrance Exam | JMI Entrance Exam
Bachelor of Design in Animation (BDes)
Exams accepted
UCEED | NIFT Entrance Exam | NID Entrance Exam
BA LLB (Bachelor of Arts + Bachelor of Laws)
Exams accepted
CLAT | AILET | LSAT India
Bachelor of Journalism & Mass Communication (BJMC)
Exams accepted
LUACMAT | SRMHCAT | GD Goenka Test