📄
Math Class 11 Notes
Class 11th Math giving a headache?
Read 11th Math Notes. / Preparation Maths Statistics
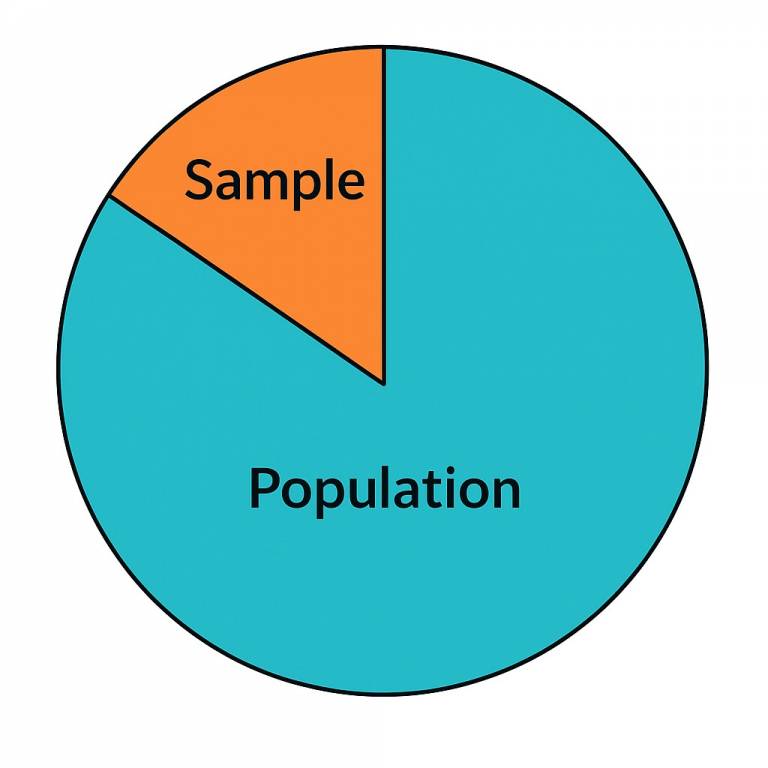
Sample statistics are the numerical descriptors for summarising and characterising different aspects of a sample that is a subset of a larger population. These are important for making inferences about the population from which the sample was drawn.

The sample statistics topic is part of the statistics chapter, and students must understand it thoroughly, as it is a component of entrance examinations. We have a page on NCERT solutions on Statistics that students must refer to understand the types of questions that are asked related to this chapter.
Here are the formulas of sample statistics for mean, and the standard deviation is as follows:
1. Sample Standard Deviation Formula
The standard deviation of the small sample statistics is calculated using the formula √(∑(xi−x̄)2/n). In order to obtain an unbiased estimation of the sample standard deviation, the n is the numerator, which is replaced by n-1 so that the formula will be:
2. Sample Mean Formula
The calculation of the Sample Mean is a little bit different from calculating the population mean. In order to compute the Sample mean, we just have to add all the data values and divide this substitution by the number of figures present in the data set. Thus, the Sample mean is as follows:
Mean
Variance
Mode = The value in the data set that occurs most frequently
There are various symbols that are used of sample statistics for parameters, and statistics are as follows. JEE Main exam and IIT JAM exam aspirants must learn about these sample statistics symbols.
| Parameter Name | Population Parameter Symbol | Sample Statistic |
|---|---|---|
| Number of cases | N | n |
| Mean | μ (mu) | x (Sample mean) |
| Proportion | π (Pi) | P (Sample proportion) |
| Variance | σ2 (Sigma-square) | s2 (Sample variance) |
| Standard deviation | σ (Sigma) | s (Sample standard deviation) |
| Correlation | ρ (Rho) | r (Sample correlation) |
| Regression Coefficient | β (Beta) | b (Sample regression coefficient) |
In research, there are mainly two types of sampling methods, including probability and non-probability sampling. These are important from NEET entrance exam point of view.
This sample selection uses randomisation rather than deliberate choice. Every member of the population has a non-zero chance of being selected. Further, there are different probability sampling methods including simple random sampling, systematic sampling, Stratified sampling and cluster sampling. Let us learn each one in detail.
This technique is used where the researcher deliberately picks items or individuals for the sample based on non-random factors, including geographic availability, convenience or costs. It also has different methods of sampling statistics, including convenience sampling, purposive sampling, quota sampling and referral sampling.
Sample statistics have several advantages, including the following:
1. Data collection from a sample is relatively less expensive than conducting a census. It makes the sample statistics more cost-efficient, especially when there is a budget constraint.
2. Sampling is time-saving since it requires fewer resources and less effort when compared to a census. CUET exam aspirants must be well aware of these advantages.
3. It might become impractical or even impossible to collect data from the entire population in many cases. In such scenarios, sampling is more feasible for conducting studies on large and dispersed populations.
3. Smaller dataset, i.e. sample, reduces the complexities of data analysis. A smaller dataset simplifies storage, data processing and interpretation, which makes it easier to handle and analyse data.
4. Sampling can provide extremely accurate results as a census if it is done correctly. It can give precise estimates of population parameters when sample represents the population.
5. It is less intrusive and disruptive, which makes it important in sensitive studies or when dealing with a difficult-to-access population.
Let us take a look at different illustrations important for students:
1. The following are the GPA scores of 30 secondary institutions. Find out the sample mean.3.1, 2.9, 2.8, 2.9, 3.8, 4.8, 4.2, 3.9, 3.4, 2.5, 4.2, 3.7, 3.3, 2.1, 3.8, 3.0, 3.7, 4.0, 2.7, 3.8, 3.2, 3.5, 3.5, 3.6, 2.2, 3.1, 3.5, 4.0, 2.7, 4.5.
Solution:
Using the formula given below to compute the sample mean:
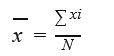
= (102.4/30)
= 3.41
Thus, the Sample mean is 3.41
2. Some students' total marks in science examinations are 101, 161, 155, 96, and 33. Find out the Sample mean marks.
Solution:

x̄ = 101+161+155+96+33/5
x̄ = 119.2
Hence, the sample marks are 119.2.

What are the 5 types of sample statistics?
Five types of sample statistics include sample mean, sample variance, sample standard deviation, sample proportion.
Maths Statistics Exam
Exams accepted
CA Foundation
Exams accepted
ICSI Exam
Exams accepted
BHU UET | GLAET | GD Goenka Test
Bachelor of Business Administration & Bachelor of Law
Exams accepted
CLAT | LSAT India | AIBE
Exams accepted
IPMAT | NMIMS - NPAT | SET
Exams accepted
BHU UET | KUK Entrance Exam | JMI Entrance Exam
Bachelor of Design in Animation (BDes)
Exams accepted
UCEED | NIFT Entrance Exam | NID Entrance Exam
BA LLB (Bachelor of Arts + Bachelor of Laws)
Exams accepted
CLAT | AILET | LSAT India
Bachelor of Journalism & Mass Communication (BJMC)
Exams accepted
LUACMAT | SRMHCAT | GD Goenka Test