 / Preparation Maths Statistics
The Assumed Mean Method is a technique in statistics to calculate the arithmetic mean (average). It is used to calculate large groups of data with large numerical values. In the assumed mean method, the mean value of the data is not calculated; instead, an assumed mean value is taken, and calculation is done around it. This process makes the calculation easy and reduces calculation errors.
The assumed mean method is an important topic in Class 11 Maths Chapter 13 Statistics. Students can check the NCERT Class 11 Math book for example problems based on the assumed mean method. The experts at Shiksha have prepared the Class 11 Math Statistics NCERT Solution to help students prepare for the exam. NCERT solutions are considered the best study materials to prepare for the board exam. Practising numerical questions based on the assumed mean method will help to understand the topic. Having a good command of statistical techniques to calculate and represent large data effortlessly. Check the article for detailed knowledge on the assumed mean method.
- What is Assumed Mean Method?
- How To Calculate The Assumed Mean?
- Weightage of Assumed Mean
- Illustrated Examples on Assumed Mean
- FAQs on Assumed Mean Method
What is Assumed Mean Method?
Assumed mean methods are used to calculate the arithmetic mean (average). This method is applicable to large data sets. Using assumed mean methods makes the calculation easy, and the probability of calculation error is lower.
How To Calculate The Assumed Mean?
The assumed mean (a) is the arithmetic mean of grouped data. This method is suggested for large data samples. It is used to calculate the standard deviation of a data set. It is suitable for calculating the mean or average for tables involving largely spaced limits. It can be calculated by the following formula given below.
Also Check: Class 12 Math NCERT Solutions | NCERT Solution Class 11 Maths
How to calculate assumed mean?
Let x1,x2,x3,...,xN be the midpoints of ‘n’ class intervals and f1, f2, f3,..., fN be the respective frequencies of these class intervals. The assumed mean can be any Xi that is the midpoint of any class. Any Xi can be assumed as an assumed mean.
Assumed Mean Method Formula
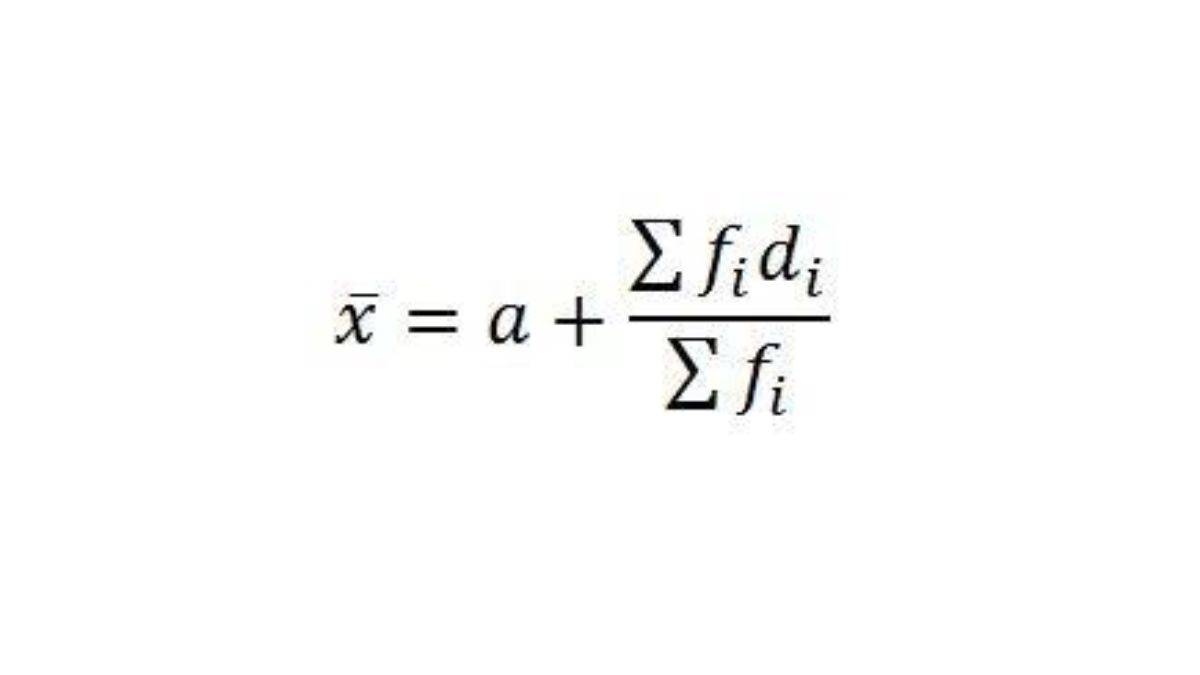
Where,
a - assumed mean
Fi- Frequency of ith class
Di=xi-a= deviation of ith class
Fi= n summation of observations
Xi=class mark= (upper class limit+lower class limit)/2
Weightage of Assumed Mean
This topic is taught 11 standard and has about 15% weightage on an overall basis. In higher classes, too, this concept of statistics has immense use. Students must focus on the topic as it is has much importance when it comes to calculate a large set of data.
Illustrated Examples on Assumed Mean
1. The following table gives information about the marks obtained by 110 students in an examination:
| Class |
0-10 |
10-20 |
20-30 |
30-40 |
40-50 |
| Frequency |
3 |
20 |
26 |
36 |
25 |
Find the mean marks of the students using the assumed mean method.
Solution.
| Class (CI) |
Frequency (fi) |
Classmark (xi) |
fiXi |
| 0-10 |
3 |
5 |
15 |
| 10-20 |
20 |
15 |
300 |
| 20-30 |
26 |
25 |
650 |
| 30-40 |
36 |
35 |
1260 |
| 40-50 |
25 |
45 |
1125 |
| Total |
Σfi =110 |
|
Σfixi = 3350 |
Mean of the data=FiXi/Fi
= 3350/110
= 34.5
2. The table below gives information about the percentage distribution of female employees in a company of various branches and several departments.
| Percentage of female employees |
Number of departments |
| 5-15 |
3 |
| 15-25 |
7 |
| 25-35 |
5 |
| 35-45 |
2 |
| 45-55 |
8 |
3. Find the mean percentage of female employees.
Solution.
| Percentage of female employees (CI) |
Number of departments (fi) |
Classmark (xi) |
FiXi |
| 5-15 |
3 |
10 |
30 |
| 15-25 |
7 |
20 |
140 |
| 25-35 |
5 |
30 |
60 |
| 35-45 |
2 |
40 |
80 |
| 45-55 |
8 |
50 |
400 |
| Total |
Σfi =25 |
|
FiXi= 710 |
Mean = (Σfixi /Σfi)
=710/25
= 28.4
4. A group of students surveyed as a part of their environmental awareness.
| Number of plants |
0 - 2 |
2 - 4 |
4 - 6 |
6 - 8 |
8 - 10 |
10 - 12 |
12 - 14 |
| Number of houses |
1 |
2 |
1 |
5 |
6 |
2 |
3 |
The program in which they collected the following data regarding the number of plants in 20 homes in a locality. Find the mean number of plants per household using the assumed mean method.
Solution.
| No. of Plants |
No.of houses (Fi) |
Xi |
Di= Xi - a |
FiDi |
| 0-2 |
1 |
1 |
1-7=-6 |
-6 |
| 2-4 |
2 |
3 |
3-7=-4 |
-8 |
| 4-6 |
1 |
5 |
5-7=-2 |
-2 |
| 6-8 |
5 |
7=a |
7-7=0 |
0 |
| 8-10 |
6 |
9 |
9-7=2 |
12 |
| 10-12 |
2 |
11 |
11-7=9 |
18 |
| 12-14 |
3 |
13 |
13-7=6 |
18 |
| Σfi =20 |
Σfidi = 32 |
Mean = a+ (Σfidi /Σfi)
= 7+(32/20)
=7+(8/5)
=8.6
FAQs on Assumed Mean Method
Q: What is the definition of an assumed mean method?
Q: How is the assumed mean method better than the ordinary mean method?
Q: Should I always use the middle Xi as the assumed men in the assumed mean method?
Q: How do I calculate the classmark for the assumed mean method and Step deviation method?
Q: What are the methods to calculate the mean of a given frequency?
The direct method can be used for classes with small frequencies and class marks. Assumed mean and step deviation can be used for large data structures.
Maths Statistics Exam
Student Forum
Other Class 11th Maths Chapters
Popular Courses After 12th
Exams accepted
CA FoundationExams accepted
ICSI ExamExams accepted
BHU UET | GLAET | GD Goenka TestBachelor of Business Administration & Bachelor of Law
Exams accepted
CLAT | LSAT India | AIBEExams accepted
IPMAT | NMIMS - NPAT | SET
Exams accepted
BHU UET | KUK Entrance Exam | JMI Entrance ExamBachelor of Design in Animation (BDes)
Exams accepted
UCEED | NIFT Entrance Exam | NID Entrance ExamBA LLB (Bachelor of Arts + Bachelor of Laws)
Exams accepted
CLAT | AILET | LSAT IndiaBachelor of Journalism & Mass Communication (BJMC)
Exams accepted
LUACMAT | SRMHCAT | GD Goenka Test