 / Preparation Physics Atoms
Learn about the line spectrum of hydrogen in detail. In Class 12 Physics chapter on Atoms, this topic is the missing link that connects the development of Bohr atomic theory and atomic spectra. We revisit the shortcomings of classical physics, how Bohr was accurate about the line spectrum with its mathematical descriptions and the spectral series of hydrogen. Use this guide to revise your Physics texts intuitively and confidently.
MikeRun, SA 4.0, Wikimedia
- Line Spectrum of Hydrogen: What is it?
- Why Early Atomic Models Couldn’t Explain the Line Spectrum of Hydrogen
- How the Bohr Model Explained the Line Spectrum of Hydrogen
- Hydrogen Spectral Series Decoded
- Line Spectrum of Hydrogen Formula: The Rydberg Equation
- A Note on the Content Reviewer
- Revision Notes for Class 12 Physics
- NCERT Solutions for Most Important Class 12 Physics Chapters
Line Spectrum of Hydrogen: What is it?
The line spectrum of hydrogen is the atomic fingerprint of the hydrogen element. It’s a unique pattern of spectral lines of different colours. They become visible at specific positions of the electromagnetic spectrum only when the electron of the H-atom is excited. This comes from Bohr’s model of the hydrogen atom.
This line spectrum is different from a continuous spectrum, which has a smooth distribution of wavelengths. It’s not like a continuous spectrum’s rainbow pattern that appears when light passes through a prism.
Bohr’s third postulate was based on the experiment when he supplied external energy, passing an electric discharge to hydrogen gas. As a result, its atoms would emit electromagnetic radiation. And when viewed through a spectroscope, it would form a unique pattern of bright lines on a dark background. That would be an atomic emission spectrum.
Such specific colours of lines would be at precise wavelengths, resembling neon signs. These distinct lines map to specific energy changes within the hydrogen atom when moving from the ground state to an excited state. That revealed the quantised nature of atomic energy levels.
It was also observed that when light passes through a gas, dark lines would appear in the spectrum. That’s technically the absorption spectrum. These dark lines show which frequencies the gas absorbed. These would match the exact wavelengths the gas would normally emit.
Such an understanding of emission and absorption spectra would later lead astrophysicists to use hydrogen’s spectral lines for element identification across vast distances in the universe.
Why Early Atomic Models Couldn’t Explain the Line Spectrum of Hydrogen
The Rutherford Nuclear Model was a significant discovery in 1911, after the Thomson Plum Pudding model, but it had two limitations. Because of these, the explanation of the spectral lines of the hydrogen atomic emission was impossible.
Ernest Rutherford’s reliance on classical electromagnetic theory created these two dilemmas.
- Atomic Instability at the Electron-Nucleus Level: Using classical physics, Rutherford’s planetary model assumed that an electron in a circular orbit is constantly accelerating. If the charged particle accelerates, it ideally should emit electromagnetic radiation continuously. That will lead to the loss of energy of the electron/charged particle. That would cause the electron to spiral inwards because of the centripetal force. Then, that would collapse and make the atom altogether unstable. But that isn’t so.
- Continuous Spectrum: Again, when considering classical physics, if the electron spirals inwards, the orbital frequency (how fast the electron circles the nucleus) would change. Following that, the frequency of the radiation emitted would also change continuously. This would create a continuous spectrum of light. That directly contradicts the discrete line spectrum observed by Niels Bohr.
These two contradictory issues in the Rutherford, aka Geiger-Marsden experiment, highlighted the need for a new framework that better helps understand atomic structure.
How the Bohr Model Explained the Line Spectrum of Hydrogen
In 1913, Niels Bohr proposed the revolutionary model of the atom that offered the explanation of the line spectrum of hydrogen. He incorporated earlier quantum theories into atomic theory that could resolve the failures of classical physics in describing atomic stability.
Stationary States or Quantised Orbits: Postulate 1
Electrons can orbit around the nucleus only in specific orbits. These orbits are stable. Without emitting energy, the orbits are said to be in stationary states. That also means these orbits have a fixed, specific energy value that does not change unless the electron goes out of it.
Quantisation of Angular Momentum: Postulate 2
Only those orbits are allowed as stationary states for which the electron's angular momentum equals an integral multiple of h/2π. Here h is Planck's constant.
Mathematically: L = n(h/2π).
And n is the principal quantum number. It can only take positive integer values: n = 1, 2, 3, …
One analogy to think about is a parking space. You can't park between spaces.
You have to use designated spots.
Electron Transitions and Photon Emission: Postulate 3
An electron can move or transition from a higher energy stationary state (n_i) to a lower energy stationary state (n_f). When doing so, it emits a photon.
The photon's energy (hν) precisely equals the energy difference: hν = E_i - E_f. And, where ν is the frequency of the emitted light.
These postulates of the Bohr model explained the observed discrete line spectrum.
By learning it as electrons exist in specific energy levels, there would be only specific energy differences are possible during transitions. This results in the emission of photons with only certain, discrete frequencies and wavelengths.
The ground state (n=1) represents the lowest energy level, while excited states (n=2, 3, 4, ...) represent energy levels that go higher as they progress farther from the nucleus. The farther an electron is from the nucleus, the higher its energy.
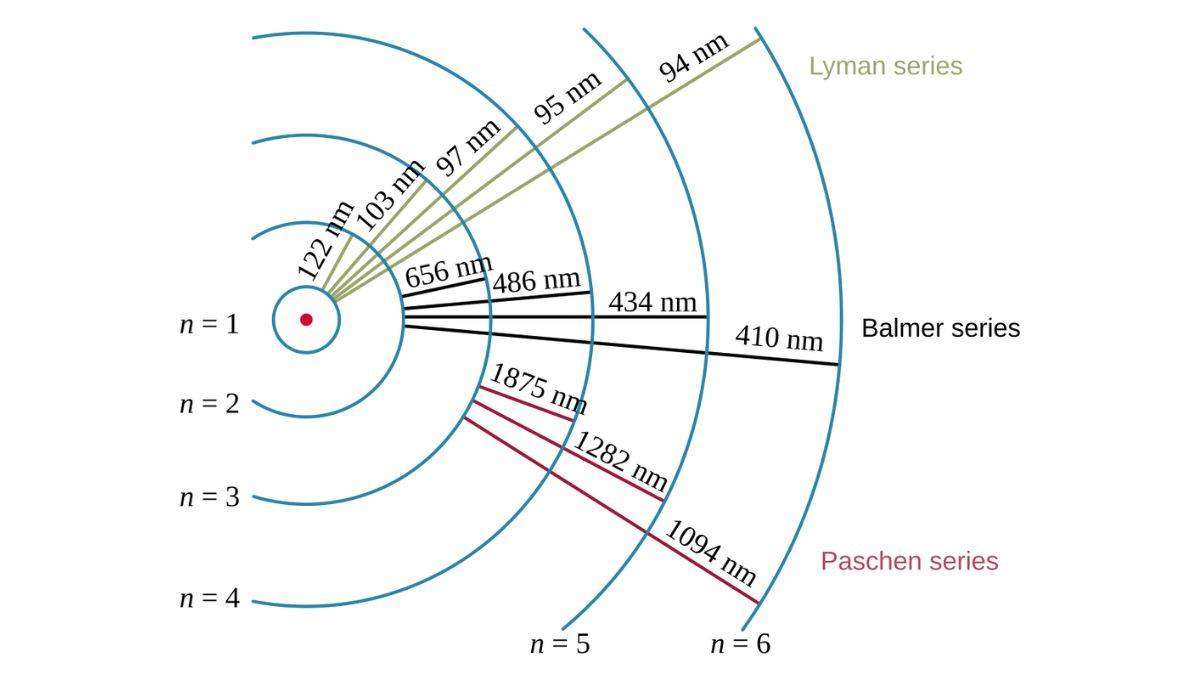
Hydrogen Spectral Series Decoded
The line emission spectrum of hydrogen is distinctly organised into different lines and these are the spectral series.
Each of the spectral series is characterised by a common final energy level (n_f) to which electrons transition. Each series was discovered by different scientists and appears in different regions of the electromagnetic spectrum.
OrangeDog, CC by 2.5, Wikimedia Commons
Lyman Series (n_f = 1)
Theodore Lyman in 1906 discovered this series and hence the name. It consists of transitions where electrons fall from higher energy levels to the ground state (n'=1).
All lines in this series show in the ultraviolet (UV) region of the electromagnetic spectrum. That indicates high energy changes.
The most prominent line in the Lyman series that maps to the 2 to 1 transition is called Lyman-alpha (Ly-α). This one has immense importance in astrophysics for studying distant galaxies and the early universe.
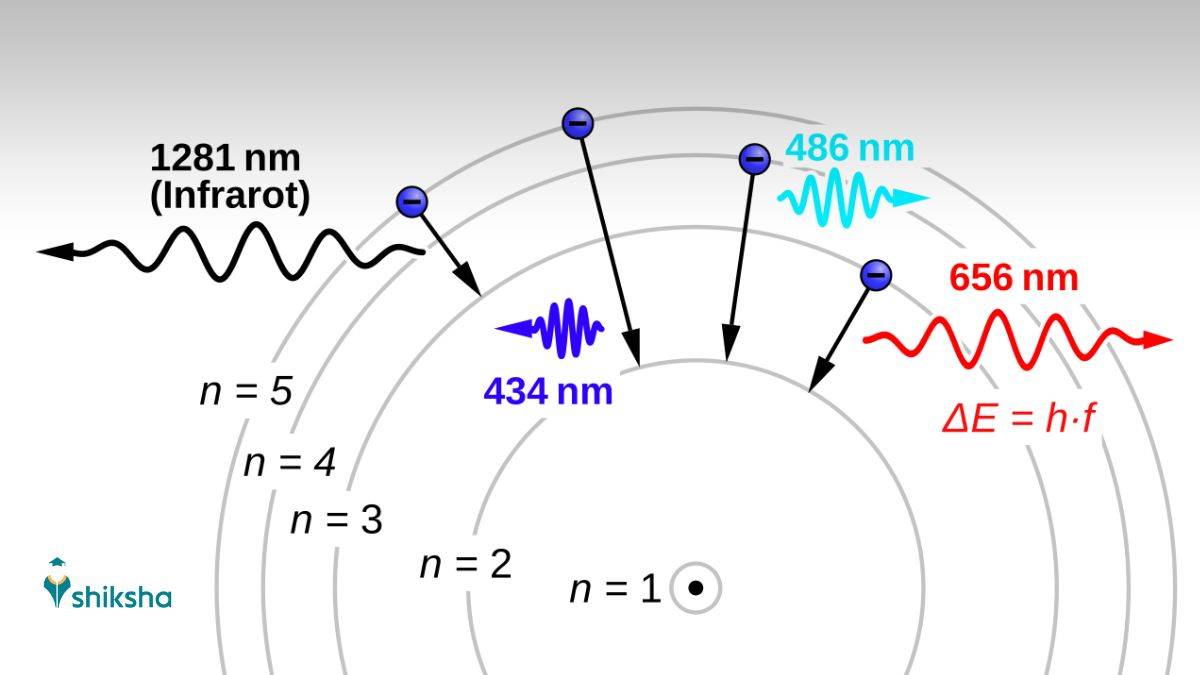
Balmer Series (n_f = 2)
This series was discovered by Johann Balmer in 1885.
In this series, the electron transitions to the first excited state (n'=2).
This is basically the lowest energy level above the ground state. It’s jumping from the third stationary state to the second, as there is energy loss.
This series is of great significance for Physics students and researchers because four of its lines fall within the visible region of the electromagnetic spectrum (400-700 nm).
The first emission line in the atomic spectrum of hydrogen in the visible range is H-alpha. This maps to the transition from the third stationary orbit to the second one. That is 3 to 2. That transition produces characteristic red light at 656.3 nm.
This line is particularly important in astronomy for observing stellar atmospheres and nebulae. Other visible lines include:
- H-beta (4 to 2, blue-green at 486.1 nm)
- H-gamma (5 to 2, violet at 434.0 nm), and
- H-delta (6 to 2, violet at 410.2 nm).
Paschen Series (n_f = 3)
This series was discovered by Friedrich Paschen in 1908.
These transitions result from electrons falling to the second excited state (n'=3). All lines in this series appear in the near-infrared region. The lines in the Paschen series are invisible to the human eye and need special detectors for observation.
Brackett Series (n_f = 4)
Discovered by Frederick Sumner Brackett in 1922, this series is linked to all transitions that end at n'=4. The lines appear in the far-infrared region.
Pfund Series (n_f = 5)
Found by August Herman Pfund in 1924, these lines from transitions to n'=5 also lie in the infrared region.
Humphreys Series (n_f = 6)
Curtis J. Humphreys in 1953 discovered this one. The transitions to n'=6 produce lines in the infrared region.
There are two important patterns to consider here.
- Lower final energy level = higher energy photons = shorter wavelengths
- Higher final energy level = lower energy photons = longer wavelengths
Line Spectrum of Hydrogen Formula: The Rydberg Equation
The Rydberg Formula quantitatively describes hydrogen’s spectral lines. With it, it becomes more accurate to calculate the wavelengths of all lines in the hydrogen spectrum.
The line spectrum of the hydrogen formula is
1/λ = R_H (1/n_f² - 1/n_i²)
The equivalent to it is another equation
ṽ = R_H (1/n_f² - 1/n_i²) (where ṽ is the wave number)
Parts of the line spectrum of the hydrogen formula are below.
- λ (lambda): As lambda is the wavelength of the emitted photon, we measure it in nanometres (nm) in this case.
- R_H: This is the Rydberg constant for hydrogen, which has a value of 1.09677 × 10⁷ m⁻¹ or 109,677.581 cm⁻¹. This empirical constant is an energy scale in hydrogen atoms.
- n_f: This represents the final state or the principal quantum number of the lower energy level. This integer tells us the series the line belongs to. If n_f = 1, that would be the Lyman series, if n_f = 2, that’s for the Balmer series, and so on.
- n_i: This remains the principal quantum number of the higher energy level. We can refer to this as the final state. This must always be greater than n_f (n_i > n_f)
Example Calculation for Rydberg Equation
Let's calculate the first emission line in the atomic spectrum of hydrogen in the visible range (H-alpha).
For this transition, n_f = 2 and n_i = 3
Using the Rydberg equation, we get
1/λ = R_H (1/2² - 1/3²) = R_H (1/4 - 1/9) = R_H (5/36)
Using R_H = 1.09677 × 10⁷ m⁻¹: 1/λ = 1.09677 × 10⁷ × (5/36) = 1.524 × 10⁶ m⁻¹ λ = 6.56 × 10⁻⁷ m = 656 nm
This calculated value matches the experimentally observed H-alpha line.
A Note on the Content Reviewer
Raghvendra Kumar Yadav has over 10 years of experience as a Physics subject matter expert. He specializes in preparing students for JEE Main and NEET as well as for Class 11 and 12. His personal experience with these types of exams after having cleared JEE Main and GATE allows him to integrate years of mentoring with profound knowledge of core Physics concepts. As a reviewer at Shiksha, he maintains clarity, correctness as well as exam readiness of concepts and explanation sets.
Revision Notes for Class 12 Physics
Find some more topics of Physics Class 12. Explore more detailed explanations of subtopics in each chapter, updated and reviewed by experts.
| Sl. No |
Name of Chapter |
|---|---|
| 1 |
|
| 2 |
|
| 3 |
|
| 4 |
|
| 5 |
|
| 6 |
Chapter 6 Electromagnetic Induction |
| 7 |
|
| 8 |
|
| 9 |
Chapter 9 Ray Optics and Optical Instruments |
| 10 |
|
| 11 |
|
| 12 |
|
| 13 |
|
| 14 |
Chapter 14 Semiconductor Electronics: Materials, Devices and Simple Circuits |
NCERT Solutions for Most Important Class 12 Physics Chapters

Commonly asked questions
What series of lines are observed in the hydrogen spectrum?
The hydrogen emission spectrum contains several spectral series, each named after its discoverer.
- Lyman series (n' = 1): To ground state, visible only in ultraviolet region
- Balmer series (n' = 2): Transitions to second level, appearing in visible region
- Paschen series (n' = 3): Moved to third level, visible in the infrared region
- Brackett series (n' = 4): Transitions to fourth level, appearing in the far infrared region
- Pfund series (n' = 5): Transitions to fifth level, showing in the infrared region
- Humphreys series (n' = 6): Transitions to sixth level, appearing in the infrared region
Why hydrogen gives a line spectrum instead of a band spectrum?
Hydrogen produces a line spectrum because electrons exist only in discrete, quantised energy levels. When electrons jump between these fixed energy states, they emit photons with specific energies (E = h? ). This creates distinct spectral lines instead of continuous wavelengths. Bohr's model explains this through quantised orbits. Classical physics, on the other hand, would predict a continuous spectrum.
Why there is a large number of lines in the hydrogen spectrum?
Hydrogen shows many spectral lines because of the following reasons.
Its electron can occupy many levels (n = 1, 2, 3.).
Each line in the hydrogen spectrum actually represents the transition from higher to lower energy levels.
These lines are grouped by the final energy level (Lyman n'=1, Balmer n'=2, etc.)
Higher energy levels are closer together. They tend to create more possible transitions.
Physics Atoms Exam
Student Forum
Other Class 12th Physics Chapters
- Physics Alternating Current
- Physics Ray Optics and Optical Instruments
- Physics Electromagnetic Induction
- Physics Dual Nature of Radiation and Matter
- Physics Semiconductor Devices
- Physics Wave Optics
- Physics Current Electricity
- Physics Nuclei
- Physics Electrostatic Potential and Capacitance
- Physics Atoms
- Physics Moving Charges and Magnetism
- NCERT Class 12 Notes
- NCERT Class 12 Physics
- Physics Electric Charge and Field
- Physics Electromagnetic Waves
- Physics Magnetism and Matter