 / Preparation Maths Statistics
Z Score Table is a mathematical table that indicates how many standard deviations a data from the mean. It is also referred to as the standard normal table. There are two types of Z-score tables: positive and negative Z-score tables.
The Z Score table is used in statistics, probability, and hypothesis testing. Moreover, it is helpful in comparing data sets and standardizing scores. It is easy to read the Z-score table. Students can go through the article to know the Z-score and types of Z-score with illustrative examples.
Must Read: NCERT Solution PDF | NCERT Class 12 Math Solution
- What is Z-score Table?
- How to read Z-Score Table?
- Weightage of Z-score Table
- Illustrative Examples on Z-score Table
- FAQs on Z-score Table.
What is Z-score Table?
Z-score is a value dependent on the mean and explains how far from the mean is one particular data point. It is an essential statistical means of analysis to compare how one value is to the “average” of a data set. Another definition would be measuring the number of standard deviations above or below the mean for a particular point. It is positive if it is above the mean and negative if below the mean.
It is used to say that this data varies by ___ much from the average of this population as a means of comparison.
To calculate the z-value, knowing the mean and standard deviation is very important. This z-score can be plotted on a normal distribution curve.
Formula of z-score:
z score = (x – μ)/ σ
μ = mean
σ = standard deviation
x = test value
The area under the normal distribution curve shows probability. To calculate the area under the curve, we calculate the z-score and construct a z-score table that describes the percentage of area to the left of the z-score to give a defined comparison.
Types of Z-Score Tables
Positive Z-score table
Here, the observed value is above the mean of all the values.
Negative Z-score table
The z-scores in these cases are below the mean, and the mean is taken to be zero, and the standard deviation is taken to be 1.
The positive and negative z-score tables are as follows:
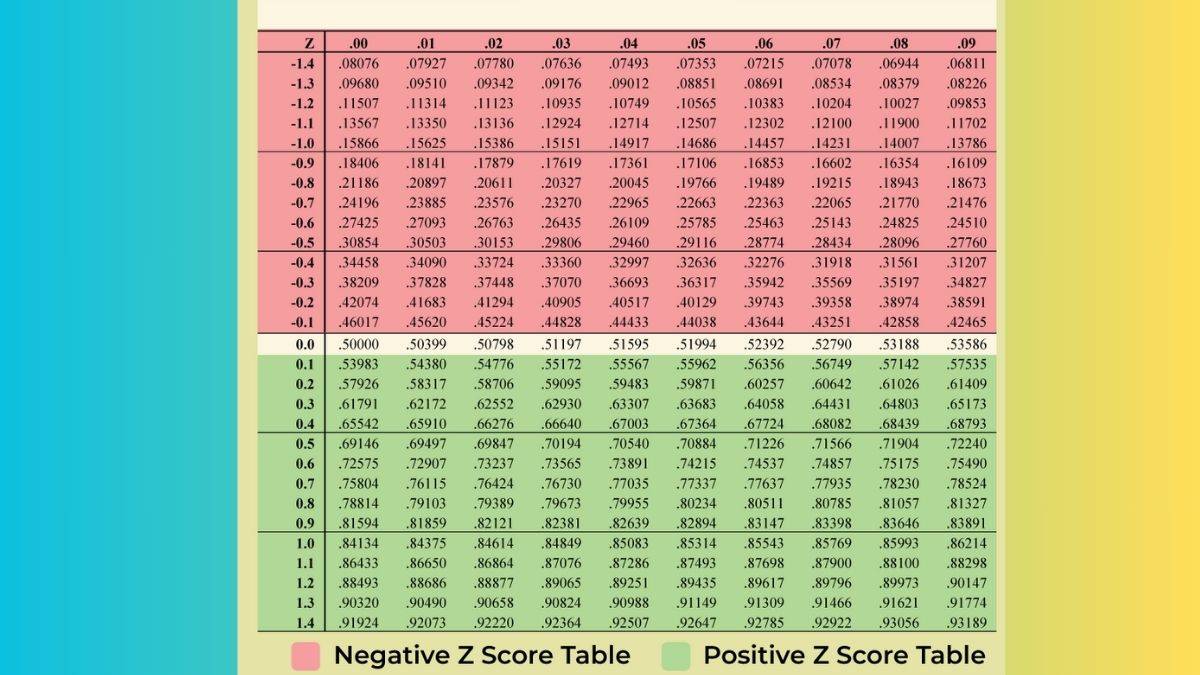
The first two digits of the z-score are checked along the y-axis and the next two along the x-axis in a z-score table.
How to read Z-Score Table?
The Z-score table consists of rows and columns. The row consists of integer values, while the columns display seconds of decimal places. The area to the left of that Z-score is represented by the value where the row and column intersect.
For example, the area for a Z-score of 1.86 is:
- Find the row for 1.8
- Find the column for 0.06
- The row and column intersect at 0.9686, which means 96.86% values lie to the left of the Z-score of 1.86
Weightage of Z-score Table
Students are introduced to this topic in Classes 11 and 12 to quantify comparison values to give correct research data. This topic will help them statistically measure values and mathematically report their analysis. This is important in the mathematical aspects of national level exams and is an extension of the concept of mean and standard deviation.
Illustrative Examples on Z-score Table
1.In a group of 100 people who took an exam, a boy scored 90/100. The average score for the test was 80 and the standard deviation was 5. How can you compare the boy’s marks to his classmates’?
Solution.
Value of x is 90, μ is 80 and σ is 5
Z-score = (x – μ)/ σ
= (90 - 80) / 5
= 2.00
Here, the z-score lies two standard deviations above the mean. The first two digits are taken along the y-axis and 0 along the x-axis. (On referring to a z-score table, we get a value of 0.9772)
Multiplying this to 100, we get 97.72%
The boy scored more than 97.72% of the people in his class.
2. If a set of data gets a z-score -2, what does it imply?
Solution.
It means that the data lies 2 standard deviations below the mean.
3. The two most popular types of Z-score tables are?
Solution.
The Z-score table helps calculate the probability by using a set of fixed values called Cumulative from the left and used for negative z-score values.
The Z-score table calculates probability from the mean, called Cumulative from the mean and used for positive z-score values.
4. Calculate z-score of a data set of standard deviation 10, mean of 500 and test value 400.
Solution.
z-score = (x – μ)/ σ
= (400- 500) / 10
= -100/10
= -10
FAQs on Z-score Table.
Q: Define the z-score table.
Q: What is the z-score value of a data set is 0?
Q: When does a Z-score table fail?
Q: What is another name for Z-score?
Q: Give the formula and explain the terms of z-score?
σ = standard deviation
x = test value
Maths Statistics Exam
Student Forum
Other Class 11th Maths Chapters
Popular Courses After 12th
Exams accepted
CA FoundationExams accepted
ICSI ExamExams accepted
BHU UET | GLAET | GD Goenka TestBachelor of Business Administration & Bachelor of Law
Exams accepted
CLAT | LSAT India | AIBEExams accepted
IPMAT | NMIMS - NPAT | SET
Exams accepted
BHU UET | KUK Entrance Exam | JMI Entrance ExamBachelor of Design in Animation (BDes)
Exams accepted
UCEED | NIFT Entrance Exam | NID Entrance ExamBA LLB (Bachelor of Arts + Bachelor of Laws)
Exams accepted
CLAT | AILET | LSAT IndiaBachelor of Journalism & Mass Communication (BJMC)
Exams accepted
LUACMAT | SRMHCAT | GD Goenka Test