CAT Data Interpretation cannot be mastered without practice. And the key is to practice questions of varied difficulty levels. Shiksha brings to you solved CAT Data Interpretation questions with solutions PDFs for practice to help you prepare well for CAT 2025.
CAT Data Interpretation or DI is a tricky section, but has the potential of high scores. As the name suggests, it expects you to interpret the data presented in the form of charts, graphs, tables, venn diagram, symbols, etc. and solve a set of questions related to it. In CAT 2025, Data Interpretation questions will be clubbed with Logical Reasoning (LR) questions. But you need to study all the DI topics extensively.
The key to crack CAT Data Interpretation (DI) questions is having strong base in Maths and Statistics. But only strong Mathematical skills is not enough. You need to have the ability to understand complex data within a minute and solve multiple questions related to it. There are 10-11 questions of DI in CAT which you need to address effectively in 20 minutes (rest 20 minutes for LR). There are charts and graphs that you need to read and understand within minutes to solve set based questions.
So, what you need to do is practice a good number of questions on data interpretation topics included in the CAT exam syllabus. In this article, we have shared a few CAT Data Interpretation questions with solutions for practice. CAT 2025 will be held on November 30, so most of you must have done ample DILR practice by now. Check below some more CAT DILR questions for practice. You can solve these now as the more you practice the better you get at handling questions from this section.
CAT Data Interpretation Questions for Practice
Directions for questions 1 to 4: Refer to the following information on prices and production of crude oil for the period 1973-80 and answer the questions given below. In the first graph, the lines show the prices of crude oil per barrel for domestic production and imports while the bars show the domestic price as a percentage of the import price. In the second graph, the bars show average production of barrels per day in the US and Non-OPEC countries, while the line shows the consumption of oil in the US.
1. In 1979, if the US imported crude oil in order to meet demands, what is the total cost of imported crude oil?
1) USD 455,800/day 2) USD 296,800/day 3) USD 376,300/day 4) USD 251,550/day
2. What is the difference between the total cost of domestic production of crude oil in the US in 1975 and the total cost of crude oil imported by the US in order to meet demands in this year?
1) USD 49,500/day 2) USD 96,750/day 3) USD 53,625/day 4) USD 65,625/day
3. Which of the following statements is/are true?
1) The percentage change in the price of imported crude oil in 1974 is approximately 120%.
2) In 1977, the absolute difference between the percentage change in the price of domestic oil and the percentage change in the price of imported oil is approximately 2.
3) The percentage change in the consumption of oil by the US from 1973 to 1979 is -80%.
4) In 1977, the ratio of production of oil by non-OPEC countries to that by the US is 4.25.
1. I only 2. II only 3. III only 4. II and III
Also Read:
4. What is the difference between the percentage change in the price of imported oil and the price of domestic oil in 1976?
1) 2.55 2) -9.95 3) -19 4) 1.25
Directions for questions 5 to 8: Table A shows the number of hits scored by leading male actors of the Bollywood film industry in the past 5 years. Table B gives data on who were leading ladies in each of these hit films. The data for the four established actresses is given separately, while the hits of all the other heroines are clubbed under the head “Others”.
| Table A |
Year |
| Actors |
2000 |
2001 |
2002 |
2003 |
2004 |
| SRK |
1 |
0 |
2 |
1 |
1 |
| VO |
1 |
2 |
0 |
0 |
1 |
| AK |
0 |
0 |
1 |
1 |
0 |
| HR |
0 |
1 |
1 |
0 |
1 |
| SK |
1 |
0 |
1 |
0 |
1 |
| Table B |
Year |
| Actresses |
2000 |
2001 |
2002 |
2003 |
2004 |
| AR |
2 |
0 |
1 |
0 |
1 |
| RM |
1 |
1 |
0 |
1 |
0 |
| PZ |
0 |
1 |
1 |
1 |
0 |
| MD |
0 |
1 |
0 |
0 |
1 |
| Others |
0 |
0 |
3 |
0 |
2 |
Note:
- AR and SK have vowed never to work together in a film. Also PZ has not yet worked with VO.
- Among the four established actresses, AK only works with RM.
- All of SRK’s hits in the past 5 years have been with only two actresses.
- VO only works with established actresses.
5. In 2002, SRK’s two hits have been with
1) AR & PZ 2) AR & others 3) PZ & others 4) RM & MD
6. MD’s two hits in the past 5 years have been with
1) VO and SK 2) VO only 3) VO and SRK 4) VO and HR
7. HR’s hits have been with
1) RM & AR 2) RM & PZ 3) Others & PZ 4) MD & AR
8. Which actor/actors had the highest number of hits with “other” actresses?
1) AK 2) HR 3) HR & SK 4) SK
CHECK OUT
Directions for questions 9 to 12: Refer to the following information and answer the CAT DI questions given below.
The table below shows the financial performance of business houses for a particular year. Study the table and answer the questions based on the information contained in the table.
| Business House |
Total Assets (TA) |
Net Worth (NW) |
Total Borrowings |
Net Sales (NS) |
Op. Profits(OP) |
| Tata |
2,671,163 |
963,496 |
1018,262 |
1,934,490 |
341,976 |
| Birla |
2,039,079 |
969,612 |
792,092 |
1,280,812 |
324,145 |
| Reliance |
1,152,904 |
719,265 |
249,749 |
549,367 |
145,801 |
| ESSAR |
1,054,419 |
342,532 |
458,843 |
155,391 |
91,092 |
| RPG |
658,631 |
286,670 |
264,555 |
289,391 |
62,580 |
| JK |
490,622 |
196,010 |
197,141 |
285,150 |
45,964 |
| Thapar |
443,936 |
207,870 |
121,217 |
357,406 |
54,782 |
| L & T |
411,672 |
211,810 |
65,605 |
305,442 |
51,689 |
| ITC |
324,964 |
125,544 |
120,442 |
313,948 |
72,257 |
| Mafatlal |
183,733 |
62,600 |
783,754 |
1,611,263 |
26,485 |
| Business House |
Gross Profit |
Net Profits (NP) |
GP/NS (%) |
GP/TA (%) |
NP/NW (%) |
| Tata |
248,422 |
156,487 |
12.8 |
9.3 |
16.2 |
| Birla |
226,078 |
145,544 |
17.7 |
11.1 |
15.0 |
| Reliance |
134,369 |
106,485 |
24.5 |
11.6 |
14.8 |
| ESSAR |
70,907 |
57,438 |
45.5 |
6.7 |
16.8 |
| RPG |
28,671 |
14,738 |
9.9 |
4.4 |
5.1 |
| JK |
27,690 |
12,660 |
9.7 |
5.6 |
6.5 |
| Thapar |
33,867 |
22,412 |
9.5 |
7.6 |
10.8 |
| L & T |
44,002 |
27,736 |
14.4 |
10.7 |
13.1 |
| ITC |
54,721 |
33,362 |
17.4 |
16.8 |
26.6 |
| Mafatlal |
16,336 |
8,905 |
10.1 |
8.9 |
14.2 |
9. If NP/NW ratio is considered to be an index of performance, which of the business houses is the best performer?
1) Tata 2) ITC 3) Birla 4) Reliance
10. If executive compensation is a function of operating profit on sales, which organisation would be the most remunerative for an executive?
1) Birla 2) Mafatlal 3) RPG 4) ESSAR
11. If dividends are a function of net profit over net worth, which company should a person invest in?
1) Tata 2) ESSAR 3) ITC 4) RPG
12. As compared to the JK group, which one of the groups could be termed as lean, i.e., having total assets £ those of JK, and thin, i.e., having borrowings £ those of JK as well as performing better, i.e., better in sales and net profits than JK?
1) ESSAR 2) Mafatlal 3) Reliance 4) ITC
Here are the Solved Answers to Questions 1-12:
Q.1 – Ans. 4
The total consumption of crude oil in the US in 1979 is 21,200 barrels per day while the total domestic production of crude oil is 9,500 barrels per day.
This means that the US has to import 11,700 barrels of crude oil per day.
In 1979, the cost of imported crude oil was $ 21.5 per barrel.
So the total cost of imported oil is 11700 ? 21.5
= $ 251,550 per day.
Q2 – Ans. 4
In 1975, the domestic production of crude oil in the US was 8250 barrels per day while the consumption was 18000 barrels per day.
This means that the US had to import 9750 barrels per day.
The price of domestic and imported oil in 1975 was $ 8 and $ 13.5 per barrel respectively.
So the total cost of domestic oil was $ 66,000 / day while the cost of imported oil was $ 131,625 per day.
Thus the required difference is $ 65,625 per day.
Q 3 – Ans. 2
The percentage change in the price of imported crude oil in 1974 is (12.5 – 4.5)/4.5 ? 177%.
So statement I is false.
The percentage change in the price of domestic crude oil is (9 - 8.5)/8.5 ? 5.88% while the percentage change in the price of imported crude oil is
(14 – 13)/13 = 7.69%.
The difference is 5.88 - 7.69 = -1.81.
So statement II is true.
The consumption of crude oil by the US has changed by (21200 – 19000)/ 19000 ? 11.57%.
So statement III is false.
The production of crude oil by non-OPEC countries and the US in 1977 is 28,000 and 9,000 respectively. The required ratio is 3.11. So statement IV is false.
Q4 – Ans. 2
The price of imported oil has changed by
(13 - 13.5)/13.5 = -3.7%, while the change in the price of domestic oil is (8.5 – 8)/8 = 6.25%.
The difference between these values is difference
= – 3.7 – 6.25= – 9.95.
Q5 – Ans. 1
If AK only works with RM, then 2003 hit of AK is with RM.
Hence SRK in 2003 combined with PZ to give a hit. If AR and SK do not work together, then AR’s two hits in 2000 are with SRK and VO.
Hence SK’s hit in 2000 is with RM.
SRK has had hits with PZ and AR in 2003 and 2000 respectively. So SRK’s hits in 2002 are with PZ and AR. Also SRK’s in 2004 is with AR. VO’s 2004 hit is with MD.
As VO has had 2 hits in 2001, at least one of them is with MD. Given that PZ has not worked with VO, then VO’s 2nd hit in 2001 is with RM. Hence in 2001, PZ has a hit with HR. So in 2002, SRK’s two hits are with PZ and AR.
Hence 1st option.
Q 6 – Ans. 2
MD’s both hits have been with VO.
Hence 2.
Q7 – Ans. 3
HR’s hits have been with PZ in 2001 and others in 2002 and 2004. Hence 3.
Q8 – Ans. 3
The 2 hits of others in 2004 are with HR and SK, and the three hits in 2002 are with AK, HR and SK.
Q9 – Ans. 2
By observing table II, we can see that NP/NW ratio is maximum for ITC.
Hence it is the best performer.
Q10 – Ans. 4
Operating Profit/Sales for Birla
= 324145/1280812 = 0.253.
Operating Profit/Sales for Mafatlal
= 26485/1611263 = 0.016.
Operating profit/Sales for RPG
= 62580/289391 = 0.216.
Operating profit/Sales for ESSAR
= 91092/155391 = 0.586.
Thus ESSAR is the best choice.
Q11 – Ans. 3
Net Profit / Net Worth is highest for ITC.
Hence a person should invest in ITC.
Q12 – Ans. 4
JK’s total assets, borrowings, sales and net profits are 490,622, 197,141, 285,150 and 12,660 respectively.
Of the given choices, ITC satisfies all the given conditions since its total assets, borrowings, sales and net profits are 324,964, 120,442, 313,948 and 33,362 respectively.
CAT Data Interpretation Questions for Practice Set 2
DIRECTIONS for questions 1 to 3: Refer to the data below and answer the CAT questions that follow.
Given below is the data for the number of Motor Vehicles in three countries X, Y and Z as on December 31, 2001 and December 31, 2011.
| |
Number of Motor Vehicles |
| As on Dec 31, 2001 |
As on Dec 31, 2001 |
| COUNTRY |
Per square mile |
Per 1000 population |
Per square kilometer |
Per 1000 population |
| X |
108.6 |
181 |
48 |
208 |
| Y |
60 |
240 |
25 |
270 |
| Z |
54 |
120 |
30 |
156 |
1 square mile = 2.6 square kilometers
1. Which of the following countries witnessed a decline in its population during the given period?
1] X 2] Y 3] Both X & Z 4] Both Y & Z
2. What is the percentage change in the population of Country Z from December 31, 2001 to December 31, 2011?
1] 10% 2] –10% 3] 11.11% 4] –11.11%
3. If the area of Country X is somewhere between 95000-100000 square miles, then its population on December 31, 2011, could have been somewhere in between:
1] 15-20 million 2] 35-40 million 3] 55-60 million 4] Cannot be determined
Directions for questions 4 to 6: Refer to the data below and answer the questions that follow:
Given below is the percentage break up of 3600 students across various streams in Thakur College of Arts, Commerce and Science:
Also given below is a table indicating the percentage break up of male students and female students across the various streams:
| Stream |
Male |
Female |
| Arts |
50% |
a% |
| Science |
20% |
b% |
| Commerce |
30% |
a% |
In the above table, ‘a’ and ‘b’ are positive real numbers and 2a is the product of 2 and ‘a’.
4. For the commerce stream, what is the ratio of the number of male students to female students ?
1] 9 : 4 2] 2 : 1 3] 5 : 3 4] Cannot be determined
5. What is the difference between the number of female students studying Arts and female students studying Science ?
1] 144 2] 216 3] 288 4] None of these
6. What is the percentage of female students in Thakur College?
1] 60% 2] 40% 3] 50% 4] Cannot be determined
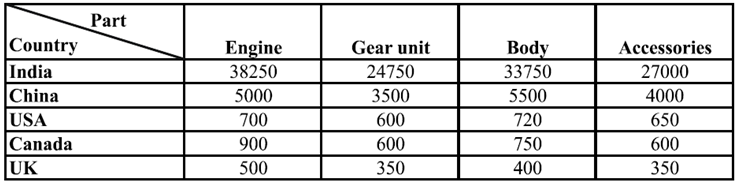
DIRECTIONS for questions 7 to 9: Refer to the data below and answer the questions that follow.
An Indian car manufacturing company ‘Wheelz’ gets its spare parts from different vendors in different countries. The above table gives the prices of these parts in each country, in terms of the currency of that country. Apart from the cost of spare parts, an additional cost of INR 20,000 is required to produce each car. There is no other additional cost involved in manufacturing a car.
In the table given below the Exchange rates of different currencies against the US dollar are given:
| Country |
Currency |
1 US Dollar equivalent |
| India |
INR |
45 |
| China |
Yuan |
6.428 |
| Canada |
Canadian Dollar |
1.071 |
| UK |
Pound |
0.5625 |
7. If Wheelz wants to manufacture a car at the least cost then what would be the expenditure in INR?
1] Rs. 132700 2] Rs. 144200 3] Rs. 131600 4] Rs. 142500
8. If Wheelz wants to buy all its spare parts from one country, then from which country should it buy the parts so that the cost is minimum?
1] India 2] China 3] Canada 4] USA
9. Wheelz sets up a new plant in the UK. It considers buying all spare parts either from China or from the UK itself. What will be the difference in cost (in pounds) in the two cases?
1] 50 2] 500 3] 250 4] 25
DIRECTIONS for questions 10 to 12: Answer the questions on the basis of the table given below.
The table gives the sales figures of a fruit vendor for three consecutive days:
Some more information is available about the total sales on three days, which is as follows:
1) The number of Apples sold is half the number of Bananas sold.
2) The number of Oranges sold is 15 more than the number of Papayas sold.
3) The number of Chikus sold is equal to the number of Jackfruits sold.
4) The difference in the number of Oranges and Apples sold is one-third the difference in the number of Strawberries and Blackberries sold.
10. Over the three days, how much did the fruit vendor earn on an average by selling one Papaya?
1] Rs.14 2] Rs.15 3] Rs.12 4] Rs.10
11. At what average selling price is one Apple sold over the three given days?
1] Rs.31.2 2] Rs.32.1 3] Rs.33.6 4] Rs.34.7
12. Find the selling price of each Jackfruit on Tuesday.
1] Rs.30 2] Rs.35 3] Rs.40 4] Rs.45
CAT DI Questions for Practice with Solutions PDFs
Check below and download free PDFs of Data Interpretation CAT questions. Solve these CAT Data Interpretation Sets to gain command on every type of DI questiona that can possibly be asked in CAT 2025.
ANSWERS to all the above questions are given below: