 / Preparation Quantitative Aptitude Prep Tips for MBA
Mean, mode and median are three primary and essential data handling tools used to segregate numbers as per their tendency and process them to receive desired results. In simpler words, they are different ways of representing average of a dataset:
- Mean: Also known as the average, Mean is total numbers divided by total number of values.
- Median: It is the middle value of a dataset in which numbers are arranged in ascending and descending order.
- Mode: It is the value that appears most frequently in a given set of data. There can be more than one mode in a given dataset.
Questions based on Mean, Mode, Media are often asked in Quantitative Aptitude section of CAT and other MBA entrance exams. The probability to get 100 % accuracy in solving questions from this unit is high. Here we share detailed discussion on Mean, Mode and Median along with formula, illustrated examples and FAQs.
- What is Mean?
- Illustrated Examples of Mean
- What is Mode?
- Illustrated Examples: Mode
- What is Median?
- Illustrated Examples: Median
- CAT Quantitative Aptitude Questions for Practice with Solutions
- FAQs Related to Mean, Mode and Median Questions


What is Mean?
Mean is one of the central tendencies of a data set that is used to represent the average of a data set. It is one of the basic yet the most important tools for ascertaining ‘average’ in statistics.
In simple terms, Mean is defined as an ‘average’ of a numerical dataset. It is calculated by adding all the observations of a data set and then dividing it by the total number of observations. Let us learn all types of Mean.
Arithmetic Mean: The most common type of representative value of a group of data is also called as ‘Arithmetic Mean’ or the ‘Mean’.
Formula of Arithmetic Mean:
x= x1+x2+x3.........xn/n
Example: Vaibhav studied 3 hours, 4 hours, and 5 hours respectively for 3 consecutive days. Calculate how many hours did he study daily on an average?
Solution: 3 + 4 + 5 / 3 = 4 hours per day
Weighted Mean: Weighted mean is a way of calculating the average of a data set where each observation has a different weight. Note, weights of the observation cannot be negative. So, the weighted mean is important in data analysis, weighted differential, and integral calculus.
Formula of Weighted Mean:
Here, x = repeating value,
w = no. of occurrence of x weight
Formula of Harmonic Mean (For Ungrouped Data)
H.M of X = n/(1/x1+1/x2+1/x3+……………+1/xn)
For example: Harmonic mean of the given data set {8,9,6,11,10,5}
HM = 6/(1/8+1/9+1/6+1/11+1/10+1/5) = 6/0.7936 = 7.560
Formula of Harmonic Mean (for Grouped Data)
HM of X = f1+f2+f3+…………….+fn/ (f1/x1+f2/x2+f3/x3+…………….+fn/xn)
Geometric Mean: It is used to calculate the geometric mean of the given data set.
Example: Find Geometric Mean of 4, 8, 3, 9, 17
Solution: total number of values (n) = 5, therefore, 1/n = 1/5 = 0.2
Now, (4*8*3*9*17) ^0.2 = 6.814
Illustrated Examples of Mean
Check below some examples of Mean:
Example 1: Calculate the mean runs scored by a batsman in 6 innings. The runs scored by him are: 36,35,50,46,60,55
Solution: 36+35+50+46+60+55/6 = 47. Thus, 47 runs were scored by the batsman in an inning.
Example 2: The data set represents the age of 10 teachers. Calculate the mean of their ages. Their ages are: 32,41,28,54,35,26,23,33,38,40
Solution: 32+41+28+54+35+26+23+33+38+40/10 = 35 years
Example 3: What is the mean of the first five natural numbers?
Solution: 1+2+3+4+5/5 = 3
What is Mode?
A mode is the repeated value occurring in a given set of data. Let's understand its types and uses.
Example: We have a data set containing numbers {2, 4, 4, 5, 4, 6, 7}. Here, the mode or modal value is ‘4’ as it has appeared the maximum number of times in the set.
What are the Types of Modes?
A mode is of three types—bimodal, trimodal, and multimodal. Let us understand them one by one.
- Bimodal: Bimodal refers to ‘two’ modes in a particular data set. When two distinct values or numbers repeat frequently, then that set is called a bimodal data set.
- Example: Consider a set {1, 2, 2, 2, 3, 4, 4, 4, 5, 6, 7}. Here, values 2 and 4 are repeating equally, i.e., thrice. Therefore, the given set mode is both 2 and 4, and so, the set is called a bimodal set.
- Trimodal: Trimodal refers to ‘three’ modes in a particular data set. When three distinct values or numbers are repeated frequently and equally, the set is called a trimodal data set.
- Example: Consider a set {1, 1, 1, 2, 2, 2, 3, 3, 3, 4, 5, 6}. Here, 1, 2, and 3 are repeating frequently and equally. Therefore, the set is a trimodal set and the mode is 1, 2, and 3.
- Multimodal: In a multimodal set, four or more modes appear in a data set. When 4 or more distinct values are repeated frequently and equally, the set is called a multimodal data set.
- Example: Consider a set {1, 1, 2, 2, 3, 3, 4, 4, 5, 6}. Here, 1, 2, 3, and 4 are repeating frequently and equally. Therefore, the mode of the given set is 1, 2, 3, and 4.
Also Read:
| VARC Preparation Tips for MBA Exams | DILR Preparation Tips for MBA Exams |
Finding Mode
The table below illustrates the wickets taken by a bowler in 10 matches. Find the modal value or mode of the given data set.
| No. of Matches Played | No. of Wickets Taken |
|---|---|
| 1 | 3 |
| 2 | 1 |
| 3 | 1 |
| 4 | 3 |
| 5 | 3 |
| 6 | 1 |
| 7 | 0 |
| 8 | 3 |
| 9 | 2 |
| 10 | 2 |
In the above-given data set, 3 is the mode as it appears frequently. But how to find mode in case of a grouped data set having a grouped frequency of data? For ascertaining the exact mode, we need to first calculate the modal class within which lies the mode.
The formula is:
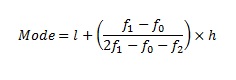
l = lower limit of the modal class,
h = size of the class interval,
f1 = modal class frequency,
f0 = modal class frequency of the preceding class,
f2 = modal class frequency of the succeeding class.
Let us understand and learn how to calculate the mode of grouped frequency distribution with the following example:
An educational survey was conducted on 20 families by a group of school students to collect data on the family size. The following table showcases data on family size and the number of families.
| Family Size | No.of Families |
|---|---|
| 1 – 3 | 7 |
| 3 – 5 | 8 |
| 5 – 7 | 2 |
| 7 – 9 | 2 |
| 9 – 11 | 1 |
The formula is:

Therefore, the mode is 3.286
Also Read:
Download More Free PDFs of Quantitative Aptitude Sample Questions and Answers for Practice
MBA Preparation 2026: Tips to Prepare for MBA Entrance Exams
Illustrated Examples: Mode
Check below some examples of Mode:
Example 1: Find the mode of the given data set: 3, 3, 3, 6, 10, 15, 15, 27, 37, 48
Solution: 3
Example 2: Find mode of the given data set: 3, 3, 3, 6, 10, 15, 15, 27, 37, 37, 37, 48
Solution: 3 and 37
Example 3: Find the mode of the given data set: 3, 6, 10, 14, 15, 27, 37, 48
Solution: No mode
What is Median?
Statistics include the study of research, introduction, perception, organisation, and data collection. The data can be used for evaluation after it is organised and displayed fittingly.
Grouped Data
The observations are grouped in ascending or descending order to determine the median of a collection of data. Then, the middle or central value of the sequence of examples gives us the median of the data.
Two instances can occur based on the following observations, i.e., either the overall number of observations would be odd or even. The median is calculated using a separate formula in both cases.
If the data set contains an odd amount of observations, then:
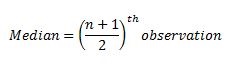
If the data set contains an even number of observations, then:
Median = Mean of (n/2)th and [(n/2) + 1]th observations.
Median of Grouped Data
We must find the cumulative frequency and n/2 to find the median of a clustered result.
And we have to find the median class, which would be the cumulative frequency class equal to or greater than the n/2 value. By combining the frequencies of all the groups preceding the given class, the total frequency is determined.
Then, replace the values in the formula with

Median formula:
where l = lower limit of the median class,
n = no. of observations,
cf = cumulative frequency of the class preceding the median class,
f = frequency of the median class,
h = size of class.
Illustrated Examples: Median
Check below some examples of Median:
Example 1: Find the median of 18, 69, and 59?
Solution: Put them in ascending order: 18, 59, 69
The middle number is 59, so the median is 59.
Example 2: Find the median of the following:
5, 18, 78, 26, 23, 93, 83, 41, 25, 15, 13, 68, 24, 30
Solution: When we put those numbers in the order we have:
5, 18, 78, 26, 23, 93, 83, 41, 25, 15, 13, 68, 24, 30
There are fifteen numbers. Our middle is the eighth number:
The median value of this set of numbers is 25.
Example 3: Amit’s family drove through seven states on winter vacation. The prices of oil differ from state to state. Calculate the median oil cost.
1.65, 1.85, 1.90, 1.74, 2.06, 2.10, 2.18
Solution: Organising the data in ascending order, we get:
1.65, 1.74, 1.85, 1.90, 2.06, 2.10, 2.18.
Hence, the median oil cost is 1.90.
Read More:
CAT Quantitative Aptitude Questions for Practice with Solutions
CAT preparation requires consistent pratice of Quantitative Aptitude questions of all types. Get here sample questions and practice tests PDFs for CAT Quantitative Aptitude with solutions. Download the Quants questions and solve them to check your preparation level.
FAQs Related to Mean, Mode and Median Questions
Explore top Mean Mode Median exams
4 Nov '26 - 29 Nov '26 | CAT 2026 admit card download |
29 Nov '26 | CAT 2026 exam date |
28 Sep '26 - 12 Oct '26 | KEA PGCET 2026 Round 1 Counsel... |
28 Sep '26 - 12 Oct '26 | Karnataka PGCET 2026: Fee Paym... |
14 Dec '26 | MAT December 2026 PBT Registra... |
17 Dec '26 | MAT December 2026 PBT admit ca... |
Oct '26 | CMAT 2027 registration and app... |
7 Feb '27 | CMAT 2027 exam |
10 Sep '26 - 14 Sep '26 | AP ICET 2026 Phase 1 Self Repo... |
9 Sep '26 | AP ICET 2026 Phase 1 Seat Allo... |
21 Aug '26 - 25 Nov '26 | SNAP 2026 Registration Process |
7 Dec '26 | SNAP 2026 admit card session 1... |
16 Jan '26 - 23 Jan '26 | IGNOU TEE Dec Result |
1 Dec '25 - 14 Jan '26 | IGNOU TEE Dec 2025 exam |
Apr '27 | MAH CET 2027 First Attempt |
May '27 | MAH CET 2027 Second Attempt |
20 Aug '26 - 25 Oct '26 | NMAT 2026 Scheduling Window |
20 Aug '26 - 25 Oct '26 | NMAT 2026 Registration Window |
Dec '26 | CUET PG 2027 Exam Notification |
Dec '26 | CUET PG 2027 Application Proce... |
12 Aug '26 | Supplementary counselling at G... |
11 Aug '26 | Supplementary counselling at G... |
15 Jul '26 - 6 Dec '26 | XAT 2027 Registration |
Oct '26 | XAT 2027 Form Correction |
18 Dec '26 | NTA CSIR NET December 2025 Exa... |
Jul '26 | NTA AIAPGET 2026 Exam Date |
14 Jan '27 - 31 Jan '27 | OJEE 2027 registrations |
22 Apr '27 - 30 Apr '27 | OJEE 2027 Admit Card Release |
18 Jun '26 - 1 Dec '26 | IBSAT 2026 Registration Test 1... |
24 Oct '26 | IBSAT 2026 Mock Test |
Dec '26 | SRCC GBO Registration 2027 |
Feb '27 | SRCC GBO 2027 Admit Card Relea... |
31 Aug '26 - 3 Sep '26 | TG ICET Spot Admission at Ins... |
24 Aug '26 | Release of TGICET 2026 Spot Co... |
Feb '27 | JET 2027 registration start |
2 May '26 | JET 2026 PG - Online PI |
31 Oct '26 | Last Date for submitting Quali... |
6 Jun '26 - 13 Jun '26 | JMI Entrance Exam 2026 Counsel... |
27 Sep '25 | PGRRCDE 2025 Exam Date |
3 Sep '25 - 25 Sep '25 | PGRRCDE Entrance Test 2024 App... |

Quantitative Aptitude Prep Tips for MBA Exam
Student Forum
 Anything you would want to ask experts?
Other Class 12th Maths Chapters
- Quantitative Aptitude Prep Tips for MBA
- Maths Integrals
- Maths Differential Equations
- Maths Vector Algebra
- Maths Matrices
- Maths Determinants
- Maths Inverse Trigonometric Functions
- Maths Differentiation
- NCERT Class 12 Maths
- Maths Continuity and Differentiability
- Maths Applications of Derivatives
- Maths Application of Integrals
- Maths Linear Programming